Download
1 / 30
300 likes | 340 Views
Theory of Demographic Transition. B. A. – III BY JAIKISHAN Assistant Professor Department of Economics GOVT. COLLEGE, ADAMPUR, HISAR 2018 - 19. World population has risen sharply. Global human population was <1 billion in 1800. Population has doubled just since 1963.

E N D
Theory of Demographic Transition B. A. – III BY JAIKISHAN Assistant Professor Department of Economics GOVT. COLLEGE, ADAMPUR, HISAR 2018 - 19
World population has risen sharply • Global human population was <1 billion in 1800. • Population has doubled just since 1963. • We add 2.5 people every second (79 million/year). Figure 7.2
Population growth rates, 1990-1995 • Growth rates vary from place to place. • Growth peaked at 2.1% in the 1960s; it has now declined to 1.3%. Figure 7.3
Some say NO: People can find or manufacture additional resources to keep pace with population growth. Nations become stronger as their populations grow. Some say YES: Not all resources can be replaced. Even if they could, quality of life suffers. Nations do not become stronger as their populations grow. Is population growth really a problem?
Modeling population and its consequences • Some models show population growth leading to resource depletion, which can result in declining food production, industrial output, and population. Figure 7.4
Increasing our carrying capacity • Technology has allowed us to raise Earth’s carrying capacity for our species time and again. • Tool-making, agriculture, and industrialization each enabled humans to sustain greater populations. Figure 7.5
Population size: Future projections Demographers project population growth trends to estimate future population sizes. Different fertility rate scenarios predict global population sizes in 2050 of 7.4 billion, 8.9 billion, or 10.6 billion. All these projections assume fertility rates below today’s; at today’s rate, the population would reach 12.8 billion. Figure 7.7
Population density and distribution Humans are unevenly distributed, living at different densities from region to region. Figure 7.8
Age structure Age structure can influence population growth rates. Figure 7.9
Sex ratios A population’s sex ratio can affect its growth rate. Figure 7.13
Factors affecting population growth rates Population growth depends on rates of birth, death, immigration, and emigration. (birth rate + immigration rate) – (death rate + emigration rate) = population growth rate
Migration can have environmental effects Immigration and emigration play large roles today. Refugees from the 1994 Rwandan genocide endured great hardship, and deforested large areas near refugee camps. Figure 7.14
Natural rate of population change Change due to birth and death rates alone, excluding migration Is often expressed in % per year
Fertility rates affect population growth rates Total fertility rate (TFR) = average number of children born per woman during her lifetime Replacement fertility = the TFR that keeps population size stable For humans, replacement fertility is about 2.1.
Total fertility rates by region African nations have the highest TFRs. European nations have the lowest TFRs.
Demographic transition theory Demographic transition = model of economic and cultural change to explain declining death rates, declining birth rates, and rising life expectancies in Western nations as they became industrialized Proposed by F. Notestein in the 1940s-1950s
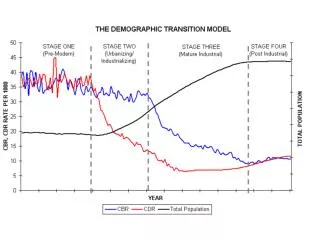
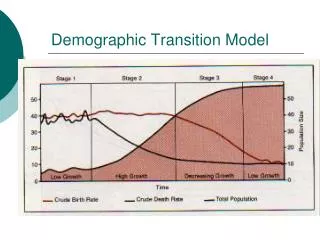
Demographic transition: Stages Figure 7.18
Demographic transition: Stages The demographic transition consists of several stages: Pre-industrial stage: high death rates and high birth rates Transitional stage: death rates fall due to rising food production and better medical care. Birth rates remain high, so population surges. Industrial stage: birth rates fall, as women are employed and as children become less economically useful in an urban setting. Population growth rate declines. Post-industrial stage: birth and death rates remain low and stable; society enjoys fruits of industrialization without threat of runaway population growth.
Female education and TFR Female literacy and school enrollment are correlated with total fertility rate: More-educated women have fewer children. Figure 7.16
Family planning and TFR Family planning, health care, and reproductive education can lower TFRs. A counselor advises African women on health care and reproductive rights. Figure 7.17b
Family planning and TFR Nations that invested in family planning (green) reduced TFRs more than similar nations that did not (red). Figure 7.17a
Poorer countries will experience most future population growth 98% of the next billion people born will live in developing nations. Figure 7.20
Population and the environment Population growth can lead to environmental degradation. Overpopulation in Africa’s Sahel region has led to overgrazing of semi-arid lands. Figure 7.21
Affluence and the environment Poverty can lead to environmental degradation… BUT wealth and resource consumption can produce even more severe and far-reaching environmental impacts.
The ecological footprint The cumulative amount of Earth’s surface area required to provide the raw materials a person or a population consumes and to dispose of or recycle the waste that is produced
The wealth gap Residents of developed nations have larger houses, more possessions, and more money than residents of developing nations. The richest 20% of the world’s people consumes 86% of its resources, and has >80 times the income of the poorest 20%. Figure 7.25
Demographic fatigue and demographic transition Many governments of developing countries are experiencing “demographic fatigue,” unable to meet the social, economic, and environmental challenges imposed by rapid population growth. This raises the question: Will today’s developing countries successfully pass through the demographic transition?
Conclusions: Challenges Human population is rising by 79 million people annually. Many more people are born into poverty than into wealth. Rich and poor nations are divided by a “wealth gap.” HIV/AIDS is taking a heavy toll. Population growth has severe environmental effects.
Conclusions: Solutions Expanding women’s rights is crucial to encourage the demographic transition. Health and reproductive education and counseling can reduce fertility rates. Education, medicine, and policies can lessen the toll of HIV/AIDS. New “green” technologies can help reduce population growth’s environmental impacts.