Download
1 / 9
90 likes | 292 Views
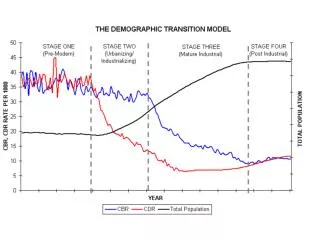
Demographic Transition Model. Description of the Graph. Stage 1, both birth rates and death rates fluctuate at a high level giving a small population growth (UK pre- 1760) Stage 2, birth rates remain high but death rates fall rapidly giving a rapid population growth. (UK 1760-1880).

E N D
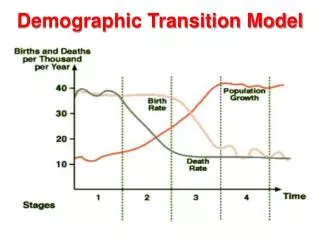
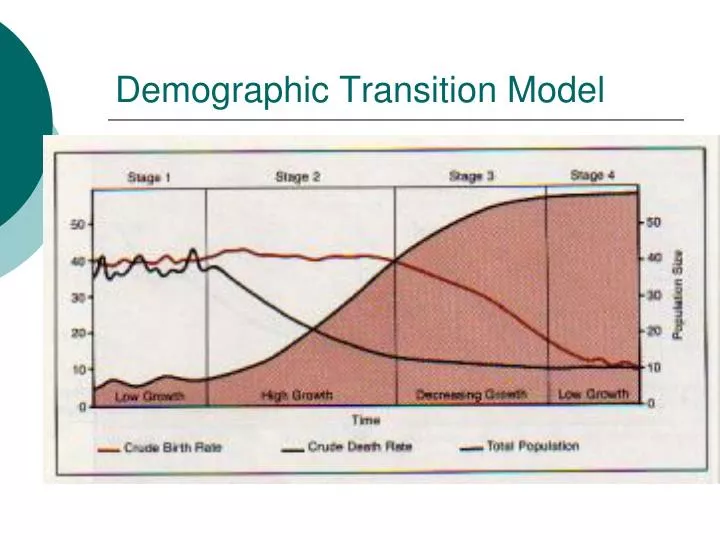
Description of the Graph • Stage 1, both birth rates and death rates fluctuate at a high level giving a small population growth (UK pre- 1760) • Stage 2, birth rates remain high but death rates fall rapidly giving a rapid population growth. (UK 1760-1880)
Stage 3, birth rates now fall rapidly while death rates continue to fall slightly to give a slow population growth. (UK 1880-1940) • Stage 4, both birth and death rates remain low and fluctuating slightly to give a steady population. (UK post 1940)
Explanation of the DTM • Birth rates are high due to • lack of contraception, • many children die in infancy so parents have more to compensate, • many children needed to work on the land, • religious beliefs, • sign of virility
Death rates are high due to • Disease, • Famine and uncertain food supply, • Poor hygiene and a lack of clean water, • Little medical services and a lack of drugs. • http://www.bbc.co.uk/learningzone/clips/cholera-epidemic-in-manchester-1832/3213.html -
Stage 2 • There is a fall in death rates due to • Improved medical care, vaccinations, doctors, new drugs, • Improved sanitation and water supply, • Improvements in food supply, • Improved transport, • Decrease in child mortality
Stage 3 • Fall in birth rates due to • Family planning, • Lower infant mortality, • Mechanisation means less need for a workforce, • Increase desire for material things, • Increased incentive for small families • More women following careers and delaying marriage and having children.
Stage 4 • Children are seen as ‘expensive’, • Later marriages • http://www.bbc.co.uk/learningzone/clips/why-is-the-uks-population-ageing/537.html
Stage 5..? • Death rate could go up as there is a greater proportion of elderly. • Birth rates remains low and could get lower • Negative natural increase and the population falls • Germany, Sweden and Italy are already in Stage 5 and the UK could enter this stage soon.