Download

1 / 48
480 likes | 745 Views
The Demographic Transition. What is the Demographic Transition?. The shift from high to low mortality and fertility through four distinct stages. Based on the experience of Western Europe’s Industrial Age. Began by Warren Thompson in 1929. Further developed in 1945 by Frank Notestein

E N D
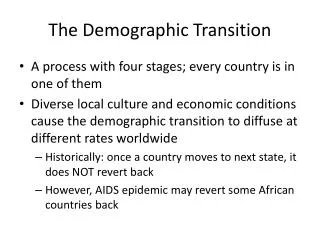
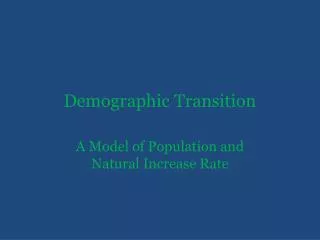
What is the Demographic Transition? • The shift from high to low mortality and fertility through four distinct stages. • Based on the experience of Western Europe’s Industrial Age. • Began by Warren Thompson in 1929. • Further developed in 1945 by Frank Notestein • A sign of socio-economic progress?
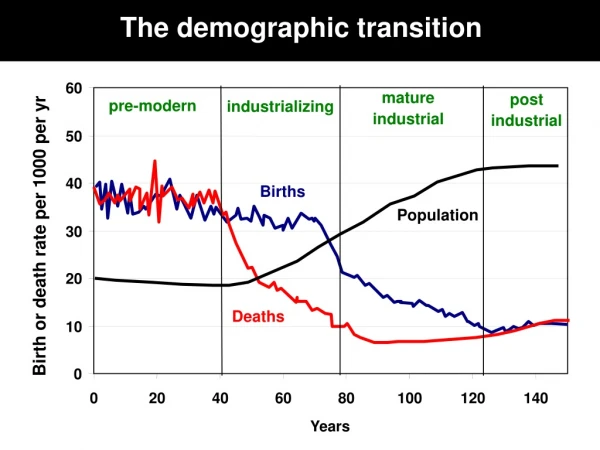
Birth rate Natural increase Death rate Time Note: Natural increase is produced from the excess of births over deaths. The Classic Demographic Transition Stage 1 Stage 2 Stage 3 Stage 4
Stage 1 - High Fluctuating • Birth Rate and Death rate are both high. Population growth is slow and fluctuating. • Reasons • Birth Rate is high as a result of: • Lack of family planning • High Infant Mortality Rate: putting babies in the 'bank' • Need for workers in agriculture • Religious beliefs • Children as economic assets • Death Rate is high because of: • High levels of disease • Famine • Lack of clean water and sanitation • Lack of health care • War • Competition for food from predators such as rats • Lack of education • Typical of Britain in the 18th century and the Least Economically Developed Countries (LEDC's) today.
Stage 2 - Early Expanding • Birth Rate remains high. Death Rate is falling. Population begins to rise steadily. • Reasons • Death Rate is falling as a result of: • Improved health care (e.g. Smallpox Vaccine) • Improved Hygiene (Water for drinking boiled) • Improved sanitation • Improved food production and storage • Improved transport for food • Decreased Infant Mortality Rates • Typical of Britain in 19th century; Bangladesh; Nigeria
Stage 3 - Late Expanding • Birth Rate starts to fall. Death Rate continues to fall. Population rising. • Reasons: • Family planning available • Lower Infant Mortality Rate • Increased mechanization reduces need for workers • Increased standard of living • Changing status of women • Typical of Britain in late 19th and early 20th century; China; Brazil.
Stage 4 - Low Fluctuating • Birth Rate and Death Rate both low. Population steady. • Economy is settled • Fully developed Middle Class • Political stability • Typical of USA; Sweden; Japan; Britain
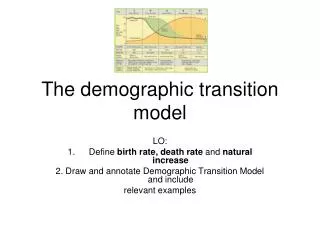
Making Population Real – Lesson Plan 2:The Demographic Transition What population patterns are revealed in the traditional Demographic Transition model? Assignment: • Construct a graph of birth and death rates in England from 1750-2000.
Making Population Real – Lesson Plan 2:The Demographic Transition
Births/Deaths per 1,000 1750 Sources: B.R. Mitchell, European Historical Statistics 1750-1970 (1976): table B6; Council of Europe, Recent Demographic Developments in Europe 2001 (2001): tables T3.1 and T4.1; CELADE, Boletin demografico 69 (2002): tables 4 and 7; Francisco Alba-Hernandez, La poblacion de Mexico (1976): 14; and UN Population Division, World Population Prospects: The 2002 Revision (2003): 326. Demographic Transition in Sweden and Mexico
Is the Demographic Transition Model Still Useful? • How well does the classic model work? • Is it a useful framework for developing countries? • Do developing countries need to share the experiences of Europe and the United States? • Is the socioeconomic change experienced by industrialized countries a prerequisite or a consequence of demographic transition?
Is the model universally applicable? • Like all models, the demographic transition model has its limitations. It failed to consider, or to predict, several factors and events: • 1 Birth rates in several MEDCs have fallen below death rates (Germany, Sweden). This has caused, for the first time, a population decline which suggests that perhaps the model should have a fifth stage added to it. • 2 The model assumes that in time all countries pass through the same four stages. It now seems unlikely, however, that many LEDCs, especially in Africa, will ever become industrialized.
Continued • 3 The model assumes that the fall in the death rate in Stage 2 was the consequence of industrialization. Initially, the death rate in many British cities rose, due to the insanitary conditions which resulted from rapid urban growth, and it only began to fall after advances were made in medicine. The delayed fall in the death rate in many developing countries has been due mainly to their inability to afford medical facilities. In many countries, the fall in the birth rate in Stage 3 has been less rapid than the model suggests due to religious and/or political opposition to birth control (Brazil), whereas the fall was much more rapid, and came earlier, in China following the government-introduced ‘one child’ policy. The timescale of the model, especially in several South-east Asian countries such as Hong Kong and Malaysia, is being squashed as they develop at a much faster rate than did the early industrialized countries. • 4 Countries that grew as a consequence of emigration from Europe (USA, Canada, Australia) did not pass through the early stages of the model.
Population Pyramid Overview • The most important demographic characteristic of a population is its age-sex structure. Age-sex pyramids (also known as population pyramids) graphically display this information to improve understanding and ease comparison. • Age-sex pyramids display the percentage or actual amount of a population broken down by gender and age. The five-year age increments on the y-axis allow the pyramid to vividly reflect long term trends in the birth and death rates but also reflect shorter term baby-booms, wars, and epidemics.
Population Pyramids • The shape of a pyramid is primarily determined by the crude death rate in the community. • Dependency ratio-the number of people who are too young or too old to work, compared to the number of people in their productive years. • People who are 0-14 and 65-plus normally are classified as dependents. • The “graying” of a population refers to the aging of a community.
Sex Ratio • The number of males per hundred females in the population is the sex ratio. In Europe and North America the ratio of men to women is about 95:100 • In poorer countries the high mortality rate during childbirth partly explains the lower percentage of women.
There are three key types of population pyramids: Rapid Growth: This pyramid of the Philippines shows a triangle-shaped pyramid and reflects a high growth rate of about 2.1 percent annually.
There are three key types of population pyramids: Slow Growth: In the United States, the population is growing at a rate of about 1.7 percent annually. This growth rate is reflected in the more square-like structure of the pyramid. Note the lump in the pyramid between the ages of about 35 to 50. This large segment of the population is the post-World War II "baby boom." As this population ages and climbs up the pyramid, there will be a much greater demand for medical and other geriatric services. An online animated population pyramid from 1950 to 2050 shows the aging of the boomers.
There are three key types of population pyramids: Negative Growth: Germany is experiencing a period of negative growth (-0.1%). As negative growth in a country continues, the population is reduced. A population can shrink due to a low birth rate and a stable death rate. Increased emigration may also be a contributor to a declining population.
Rapid Growth in Cape Verde Fig. 2-17: Cape Verde, which entered stage 2 of the demographic transition in about 1950, is experiencing rapid population growth. Its population history reflects the impacts of famines and out-migration.
Moderate Growth in Chile Fig. 2-18: Chile entered stage 2 of the demographic transition in the 1930s, and it entered stage 3 in the 1960s.
Low Growth in Denmark Fig. 2-19: Denmark has been in stage 4 of the demographic transition since the 1970s, with little population growth since then. Its population pyramid shows increasing numbers of elderly and few children.
Demographic Transition and World Population Growth • How many countries are in each of the following stages of the demographic transition? • Stage 1- None • Stage 2 and 3- majority of countries • Stage 4- None
Two “big breaks” & their causes • The first break-the sudden drop in the death rate that comes from technological innovation • The second break-sudden drop in the birth rate that comes from changing social customs
Malthus Theory and Reality • Food production increased more rapidly than predicted • Population didn’t quadruple Population is increasing a slower rate
Food & Population, 1950-2000Malthus vs. Actual Trends Fig. 2-20: Malthus predicted population would grow faster than food production, but food production actually expanded faster than population in the 2nd half of the 20th century.
Reasons for declining birth rates • What are the two ways to bring birth rates down? • Lower birth rates • Higher death rates • What two strategies have proven successful to lower birth rates? • Reliance on economic development • Distribution of contraceptives
Crude Birth Rate Decline, 1980-2005 Fig. 2-21: Crude birth rates declined in most countries during the 1980s and 1990s (though the absolute number of births per year increased from about 120 to 130 million).
Use of Family Planning Fig. 2-22: Both the extent of family planning use and the methods used vary widely by country and culture.
World Health Threats • This transition occurs as a country undergoes the process of modernization or economic development. Less economically developed countries have higher rates of infectious diseases as standards of medical care are lower than that found in more economically developed countries. • In more economically developed countries, more people die from degenerative diseases as infectious diseases such as cholera and typhoid are easily treated, causing more people to die from cancers as they live longer.
Epidemiologic Transition- stage 1 • The first transition was from hunting-gathering to primary food production. During this transition, infectious and parasitic diseases became prevalent. The shift to agriculture provides a more sedentary way-of-life and this creates more opportunities for contact with infected animals and human waste (i.e. vectors and vehicles of transmission).
Epidemiologic Transition –stage 2 • The second epidemiological transition occurred in modern times with infectious diseases under control and chronic, noninfectious, degenerative diseases rising. This second epidemiological transition is typically in the wealthy or developed nations. Developing nations still suffer from infectious diseases more than chronic diseases.
Epidemiologic Transition- stage 3 • The stage of generative and human-created diseases, characterized by a decrease in deaths from infectious diseases and an increase in chronic disorders associated with aging. Two important chronic disorders are cardiovascular diseases and various forms of cancer
Epidemiologic Transition- stage 4 • The stage of delayed degenerative diseases. The major degenerative causes of death-cardiovascular diseases and cancers. Life expectancy of older people is extended through medical advances
Epidemiologic Transition-stage 5 • The stage of reemergence of infectious and parasitic diseases. Infectious diseases thought to have been eradicated or controlled have returned, and new ones have emerged.
Cholera in London, 1854 Fig. 2-23: By mapping the distribution of cholera cases and water pumps in Soho, London, Dr. John Snow identified the source of the water-borne epidemic.
Tuberculosis Death Rates Fig. 2-24: The tuberculosis death rate is good indicator of a country’s ability to invest in health care. TB is still one of the world’s largest infectious disease killers.
HIV/AIDS Prevalence Rates, 2005 Fig. 2-26: The highest HIV infection rates are in sub-Saharan Africa. India and China have large numbers of cases, but lower infection rates at present.