Download

1 / 18
190 likes | 204 Views
Demographic Transition Model. The demographic transition model shows population change over time. It studies how birth rate and death rate affect the total population of a country. The five stages of the demographic transition model.

E N D
The demographic transition model shows population change over time. • It studies how birth rate and death rate affect the total population of a country.
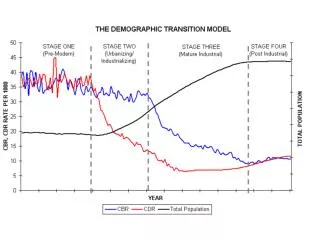
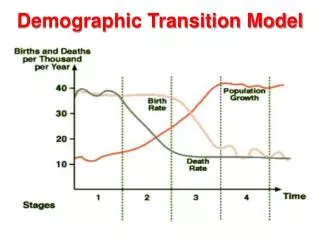
The five stages of the demographic transition model • 1. Total population islow but itisbalanced due to high birth rates and high death rates. • 2. Total population rises as death rates fall due to improvements in health care and sanitation. Birth rates remainhigh. • 3. Total population isstillrisingrapidly. The gap betweenbirth and death rates narrows due to the availability of contraception and fewerchildrenbeingneeded to work - due to the mechanisation of farming. The naturalincreaseishigh.
4. Total population is high, but it is balanced by a low birth rate and a low death rate. Birth control is widely available and there is a desire for smaller families. • 5. Total population is high but going into decline due to an ageing population. There is a continued desire for smaller families, with people opting to have children later in life.
As a country passes through the demographic transition model, the total population rises. • Most LEDCs are at stage 2 or 3 (with a growing population and a high natural increase). • Most MEDCs are now at stage 4 of the model and some such as Germany have entered stage 5.
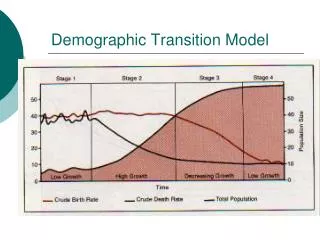
As populations move through the stages of the model, the gap betweenbirth rate and death rate first widens, thennarrows. • In stage 1 the two rates are balanced. • In stage 2 theydiverge, as the death rate falls relative to the birth rate. • In stage 3 theyconvergeagain, as the birth rate falls relative to the death rate. • Finallyin stage 4 the death and birth rates are balancedagain but at a muchlowerlevel.
Limitations of the model • 1. The model was developed after studying the experiences of countries in Western Europe and North America. Conditions might be different for LEDCs in different parts of the world. • 2. The original model doesn't take into account the fact that some countries now have a declining population and a 5th stage. Most texts will now show this stage as it is relevant to an increasing number of MEDCs in the 21st century.
Stage 1 - High Stationary • Birth Rate and Death rate are both high. • Population growthis slow and fluctuating.
Reasons Birth Rate ishigh as a result of: • Lackof family planning • High Infant Mortality Rate • Need for workers in agriculture • Religiousbeliefs .
Death Rate is high because of: • High levels of disease • Famine • Lack of clean water and sanitation • Lack of health care • War • Competition for foodfrompredatorssuch as rats • Typical of Britain in the 18th century and the Least EconomicallyDeveloped Countries (LEDC's
Stage 2 - Early Expanding • Birth Rate remainshigh. Death Rate isfalling. • Population begins to risesteadily.
Reasons • Death Rate isfalling as a result of: • Improvedhealth care (e.g. Smallpox Vaccine) • ImprovedHygiene (Water for drinkingboiled) • Improvedsanitation • Improvedfood production and storage • Improved transport for food • Decreased Infant Mortality Rates • Typical of Britain in 19th century; Bangladesh; Nigeria
Stage 3 - Late Expanding • Birth Rate starts to fall. Death Rate continues to fall. • Population rising.
Reasons: • Family planning available • Lower Infant Mortality Rate • Increasedmechanizationreducesneed for workers • Increased standard of living • Changingstatus of women • Typical of Britain in late 19th and early 20th century; China; Brazil
Stage 4 - Low Stationary • Birth Rate and Death Rate both low. Population steady. • Typical of USA; Sweden; Japan; Britain
Stage 5 - Declining Population • Birth Rate remains low. • Death rate begins to rise slightly, resulting in a declining population • Death rate rises slightly due to lifestyle choices such as a poor diet and smoking • Examples: Germany, Scotland