Download
1 / 13
130 likes | 203 Views
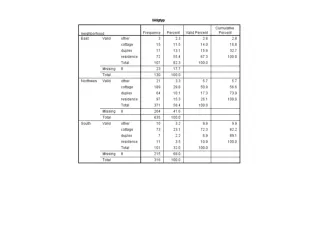
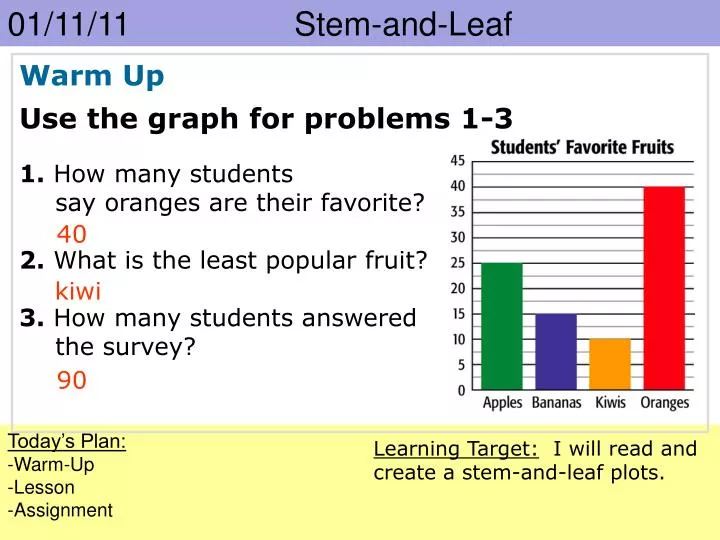
01/11/11 Stem-and-Leaf . Warm Up 1. How many students say oranges are their favorite? 2. What is the least popular fruit? 3. How many students answered the survey?. Use the graph for problems 1-3. 40. kiwi. 90. Today’s Plan: -Warm-Up -Lesson -Assignment.

E N D
01/11/11 Stem-and-Leaf Warm Up 1.How many students say oranges are their favorite? 2. What is the least popular fruit? 3. How many students answered the survey? Use the graph for problems 1-3 40 kiwi 90 Today’s Plan: -Warm-Up -Lesson -Assignment Learning Target: I will read and create a stem-and-leaf plots.
01/11/11 Stem-and-Leaf Turn in worksheets Today’s Plan: -Warm-Up -Lesson -Assignment Learning Target: I will read and create a stem-and-leaf plots.
01/11/11 Stem-and-Leaf 2 4 7 9 3 0 6 Have you seen stem-and-leaf plots before? How do you read the numbers? Today’s Plan: -Warm-Up -Lesson -Assignment Learning Target: I will read and create a stem-and-leaf plots.
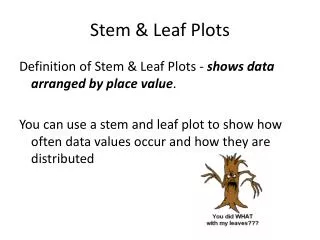
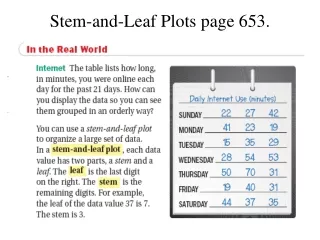
Frequency Tables and Stem-and-Leaf Plots 1-3 Stems Leaves 2 4 7 9 3 0 6 Course 2 A stem-and-leaf plot can be used to show how often data values occur and how they are distributed. Each leaf on the plot represents the right-hand digit in a data value, and each stem represents left-hand digits. Key:2|7 means 27
01/11/11 Stem-and-Leaf 2 5 = 25 A stem-and-leaf plot is another way to display data. The values are grouped so that all but the last digit is the same in each category. Stem = first digits(s) Leaf = last digit Today’s Plan: -Warm-Up -Lesson -Assignment Learning Target: I will read and create a stem-and-leaf plots.
01/11/11 Stem-and-Leaf List the data values of the stem-and-leaf plot. 1 2 5 4 0 1 1 5 2 7 9 Key: 1 2 means 12 The data values are: 12, 15, 40, 41, 41, 52, 57, and 59. Today’s Plan: -Warm-Up -Lesson -Assignment Learning Target: I will read and create a stem-and-leaf plots.
01/11/11 Stem-and-Leaf List the data values of the stem-and-leaf plot. 2 3 6 3 7 8 9 4 2 5 6 Key: 2 3 means 23 The data values are: 23, 26, 37, 38, 39, 42, 45, and 46. Today’s Plan: -Warm-Up -Lesson -Assignment Learning Target: I will read and create a stem-and-leaf plots.
01/11/11 Stem-and-Leaf Use the given data to make a stem-and-leaf plot. Key: 4 2 means 42 mi/h 4 2 3 5 5 0 6 1 4 Speeds range from 42 to 64 so stems are 4 to 6. Today’s Plan: -Warm-Up -Lesson -Assignment Learning Target: I will read and create a stem-and-leaf plots.
Frequency Tables and Stem-and-Leaf Plots 1-3 Course 2 Additional Example 2: Organizing Data in a Stem-and-Leaf Plot The data shows the number of years coached by the top 15 coaches in the all-time NFL coaching victories. Make a stem-and-leaf plot of the data. 33, 40, 29, 33, 23, 22, 20, 21, 18, 23, 17, 15, 15, 12, 17 Step 1: Find the least data value and the greatest data value. Since the data values range from 12 to 40, use tens digits for the stems and ones digits for the leaves.
Frequency Tables and Stem-and-Leaf Plots 1-3 Stems Leaves Course 2 Additional Example 2 Continued The data shows the number of years coached by the top 15 coaches in the all-time NFL coaching victories. Make a stem-and-leaf plot of the data. 33, 40, 29, 33, 23, 22, 20, 21, 18, 23, 17, 15, 15, 12, 17 Step 2: List the stems from least to greatest on the plot. The stems are the tens digits. 1 2 3 4
Frequency Tables and Stem-and-Leaf Plots 1-3 Stems Leaves Course 2 Additional Example 2 Continued The data shows the number of years coached by the top 15 coaches in the all-time NFL coaching victories. Make a stem-and-leaf plot of the data. 33, 40, 29, 33, 23, 22, 20, 21, 18, 23, 17, 15, 15, 12, 17 Step 3: List the leaves for each stem from least to greatest. The stems are the tens digits. The leaves are the ones digits. 8 5 5 7 7 2 1 2 3 4 0 3 2 3 9 1 3 3 0
Frequency Tables and Stem-and-Leaf Plots 1-3 Stems Leaves 8 5 5 7 7 2 1 2 3 4 0 3 2 3 9 1 3 3 0 Course 2 Additional Example 2 Continued The data shows the number of years coached by the top 15 coaches in the all-time NFL coaching victories. Make a stem-and-leaf plot of the data. 33, 40, 29, 33, 23, 22, 20, 21, 18, 23, 17, 15, 15, 12, 17 Step 4: Add a key and a title. Number of Years Coached The stems are the tens digits. The leaves are the ones digits. Key: 2 | 1 means 21.
01/11/11 Stem-and-Leaf Assignment Page16 #2, 4,5,6,9,11 Today’s Plan: -Warm-Up -Lesson -Assignment Learning Target: I will read and create a stem-and-leaf plots.