Download
1 / 34
340 likes | 348 Views
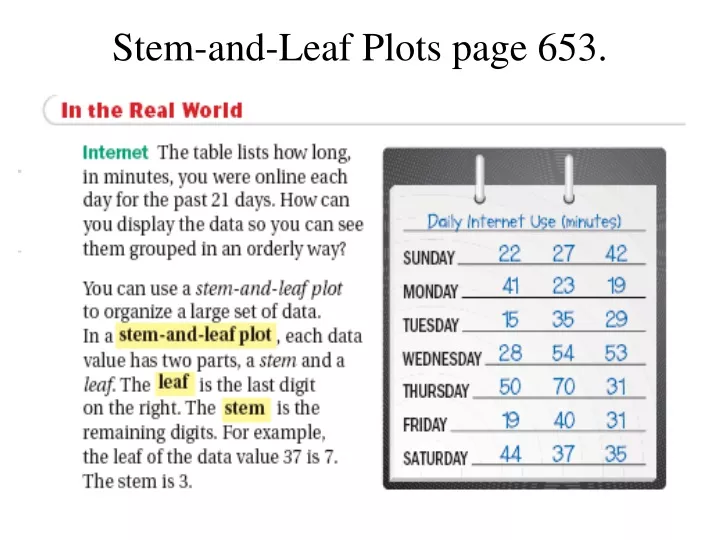
Stem-and-Leaf Plots page 653. EXAMPLE 1. Making a Stem-and-Leaf Plot. To organize the minutes online in the table above, you can make a stem-and-leaf plot. The numbers range from 15 to 70 . So, the least stem is 1 and the greatest stem is 7. EXAMPLE 1. Making a Stem-and-Leaf Plot.

E N D
EXAMPLE 1 Making a Stem-and-Leaf Plot To organize the minutes online in the table above, you can make a stem-and-leaf plot. The numbers range from 15 to 70. So, the least stem is 1 and the greatest stem is 7.
EXAMPLE 1 Making a Stem-and-Leaf Plot To organize the minutes online in the table above, you can make a stem-and-leaf plot. The numbers range from 15 to 70. So, the least stem is 1 and the greatest stem is 7. STEP 1 Order stems from least to greatest. 1 2 3 4 5 6 7
EXAMPLE 1 Making a Stem-and-Leaf Plot STEP 2 Write the leaves next to their stems. 1 2 3 4 5 6 7 9 5 9 2 7 3 9 8 5 1 1 7 5 2 1 0 4 4 3 0 This stands for 53. 0
EXAMPLE 1 Making a Stem-and-Leaf Plot STEP 3 Order the leaves from least to greatest. 1 2 3 4 5 6 7 5 9 9 2 3 7 8 9 1 1 5 5 7 0 1 2 4 0 3 4 Key:53=53 0 Be sure to include a key.
for Example 1 GUIDED PRACTICE 1. Make a stem-and-leaf plot of the data 31, 14, 22, 51, 33,16, 21, 24, 22, 15, 30, 28, and 39.
EXAMPLE 2 Interpreting Stem-and-Leaf Plots Diners The stem-and-leaf plot shows the ages of people at a diner. 4 6 7 9 0 1 2 3 0 1 1 2 2 2 4 9 2 5 8 0 1 4 Key: 3 1= 31
EXAMPLE 2 Interpreting Stem-and-Leaf Plots Diners The stem-and-leaf plot shows the ages of people at a diner. 4 6 7 9 0 1 2 3 a. What is the range of the ages? 0 1 1 2 2 2 4 9 2 5 8 0 1 4 Key: 3 1= 31
EXAMPLE 2 Interpreting Stem-and-Leaf Plots Diners The stem-and-leaf plot shows the ages of people at a diner. 4 6 7 9 0 1 2 3 a. What is the range of the ages? 0 1 1 2 2 2 4 9 2 5 8 0 1 4 Key: 3 1= 31 SOLUTION a. The youngest person at the diner is 4 years old, because the least data value is 0 | 4. The oldest is 34 years old, because the greatest data value is 3 | 4. The range is 30 years, because 344= 30. –
EXAMPLE 2 Interpreting Stem-and-Leaf Plots 4 6 7 9 0 1 2 3 b. Describe the age group with the most people. 0 1 1 2 2 2 4 9 2 5 8 0 1 4 Key: 3 1= 31 SOLUTION The stem of 1 has more leaves than any other, so the age group with the most people is 1019 years. –
Central Tendencies Range Mean ( ) The difference Between The largest And Smallest Numbers. 11 – 5 = 6 Add all of the numbers Divide the answer by how many numbers you added. 5, 6, 8, 5, 7, 11 = 42 42 ÷ 6 = 7 Median When a set of data is in Numerical order the median Is the number in the middle 5, 5, 6, 7, 8, 11 = 6.5 6 + 7 = 13 13 ÷ 2 = 6.5 Or In an odd set of numbers 5, 5, 6, 7, 8 = 6 MOde The number(s) that occur MOst often: 5, 6, 8, 5, 7, 11
Essential Question: Collect data Mean sum of all data values divided by the number of values, sometimes called the AVERAGE, affected by all values Median: middle value once the numbers are placed in order (If two numbers are in the middle, add the numbers and divide by two) Mode: value(s) that occurs the MOST often. There can be more than one mode Range: The difference between the largest number and the smallest number.
Mean • 4, 5, 6, 4, 7, 4, • Step 1: add all values together • Step 2: Divide the sum by the number of values. • The quotient is the mean. • ReturnFinding Mean:
Mean Return
Median • 4, 5, 6, 4, 7, 4, • First put the numbers in numerical order. • Find the number in the middle. Take one off of each end until you only have one number left. • If you have two numbers left find their mean and it will be the median. • Return
Mode • 4, 5, 6, 4, 7, 4, • The number(s) that occur the most. • If all numbers occur only one time there is no mode. • Return
Range • 4, 5, 6, 4, 7, 4, • Find the Largest number and the smallest number. • Subtract them. • The difference is the range. • ReturnTeachertube:Brainpop
The Measures of Central Tendency & Range Essential Question: Essential Question: Collect Data Mean sum of all data values divided by the number of values, sometimes called the AVERAGE, affected by all values Median: middle value once the numbers are placed in order (If two numbers are in the middle, add the numbers and divide by two) Mode: value(s) that occurs the MOST often. There can be more than one mode Range: The difference between the largest number and the smallest number.
Key:57= 5.7 44.8 7 EXAMPLE 3 Finding the Mean, Median, and Mode Use the stem-and-leaf plot shown below. 7 7 a. 5 6 7 Find the mean. 1 2 7 b. Find the median. 0 4 c. Find the mode. SOLUTION Make an ordered list of the 7 values in the stem-and-leaf plot. 5.7,5.7,6.1,6.2,6.7,7.0,7.4 5.7 + 5.7 + 6.1 + 6.2 + 6.7 + 7.0 + 7.4 Mean 6.4 a. = = = 7
Key:57= 5.7 EXAMPLE 3 Finding the Mean, Median, and Mode Use the stem-and-leaf plot shown below. 7 7 a. 5 6 7 Find the mean. 1 2 7 b. Find the median. 0 4 c. Find the mode. SOLUTION Make an ordered list of the 7 values in the stem-and-leaf plot. 5.7,5.7,6.1,6.2,6.7,7.0,7.4 Median b. 6.2, because the middle value is6.2. =
Key:57= 5.7 EXAMPLE 3 Finding the Mean, Median, and Mode Use the stem-and-leaf plot shown below. 7 7 a. 5 6 7 Find the mean. 1 2 7 b. Find the median. 0 4 c. Find the mode. SOLUTION Make an ordered list of the 7 values in the stem-and-leaf plot. 5.7,5.7,6.1,6.2,6.7,7.0,7.4 c. 5.7, because it is the only value that occurs more than once. Mode =
for Examples 2 and 3 GUIDED PRACTICE 2. Use the stem-and-leaf plot in Example 2. How many people at the diner are over 20 years old? What are their ages? 4 6 7 9 0 1 2 3 0 1 1 2 2 2 4 9 2 5 8 ANSWER 0 1 4 6;22,25,28,30,31, and 34 Key: 3 1= 31
for Examples 2 and 3 GUIDED PRACTICE Find the mean, median, and mode(s) of the data.
for Examples 2 and 3 GUIDED PRACTICE Find the mean, median, and mode(s) of the data. 1 7 9 3. 3 4 5 6 2 2 3 6 0 4 7 7 7 2 5 8 Key: 3 1 = 31
for Examples 2 and 3 GUIDED PRACTICE Find the mean, median, and mode(s) of the data. 1 7 9 3. 3 4 5 6 2 2 3 6 0 4 7 7 7 2 5 8 Key: 3 1 = 31 ANSWER 50, 50, 57
for Examples 2 and 3 GUIDED PRACTICE 2 3 5 9 5. 1 2 3 4 3 6 7 8 9 1 1 2 4 6 Key: 1 2 = 12
for Examples 2 and 3 GUIDED PRACTICE 2 3 5 9 5. 1 2 3 4 3 6 7 8 9 1 1 2 4 6 Key: 1 2 = 12 ANSWER 29, 27.5, 41