Download
1 / 15
160 likes | 172 Views
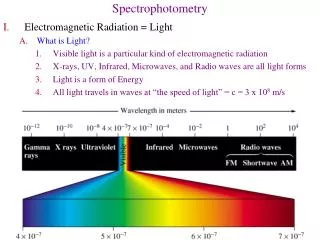
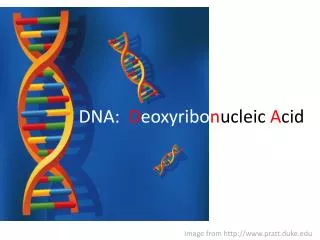
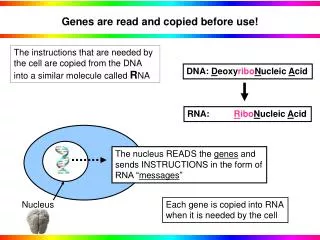
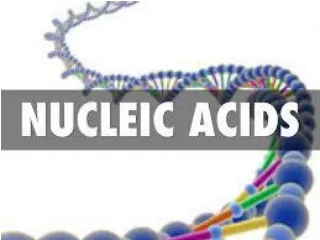
SPECTROPHOTOMETRY (Quantification of N ucleic A cids). Pauline Asami BecA-ILRI Hub Introduction to Bioinformatics and Molecular Biology (IMBB). May, 2016. Nucleic acids. The rings of the bases (A, C, G, T, U) are made up of alternating single and double bonds.

E N D
SPECTROPHOTOMETRY(Quantification of Nucleic Acids) Pauline Asami BecA-ILRI Hub Introduction to Bioinformatics and Molecular Biology (IMBB) May, 2016
Nucleic acids • The rings of the bases (A, C, G, T, U) are made up of alternating single and double bonds. • Such ring structures absorb in the U.V. • Each of the four nucleotide bases has a slightly different absorption spectrum, and the spectrum of DNA is the average of them.
Spectrophotometer • An instrument employed to measure the amount of light that a sample absorbs. • Consists of two instruments: • A spectrometer for producing light of any selected color (wavelength) • A photometer for measuring the intensity of light
It operates on Beer’s law: • When monochromatic light (light of a specific wavelength) passes through a solution there is usually a quantitative relationship (Beer's law) between the solute concentration and the intensity of the transmitted light, that is, the more concentrated the specimen is, the less light is transmitted through it. Source: NFS BIOTEKS
Therefore: The concentration of a substance in directly proportional to the amount of light absorbed.
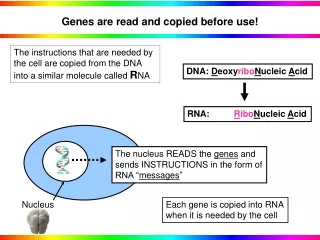
DNA Analysis (After extraction) Nucleic acid (DNA/RNA) Qualitative analysis Quantitative analysis Size-Quality Purity- Yield Agarose gel electrophoresis Spectrophotometry
Why Quantify? • To check concentration and purity of DNA/RNA present in the solution. • Determine if samples are useful for downstream applications like: • PCR Restriction digests. • Advantages of the nanodrop • It is a simple machine and economical on space. • Easy-to-use spectrophotometer • Can measure small volumes of DNA, RNA and • protein concentrations. Source: Google images
Spectrophotometric measures • Measures DNA, RNA (A260) and Proteins (A280) concentrations and sample purity (260:280). • Absorbance at 260 nm • Nucleic acids absorb UV light at 260 nm due to the aromatic base moieties • within their structure. Purines (thymine, cytosine and uracil) and pyrimidines (adenine and guanine) both have peak absorbances at 260 nm, thus making it • the standard for quantitating nucleic acid samples. • Absorbance at 280 nm • The 280 nm absorbance is measured where proteins and phenolic compounds have a strong absorbance. Similarly, the aromaticity of phenol groups of organic compounds absorbs strongly near 280 nm. • Absorbance at 230 nm • Many organic compounds have strong absorbances at around 225 nm. In addition to phenol, TRIzol, and chaotropic salts, the peptide bonds in proteins absorb light between 200 and 230 nm.
Spectrophometric measurements • The A260/280 ratio shows the purity of the sample analysed. • A260/230 ratio indicates the presence of organic contaminants, such as (but not limited to): phenol, TRIzol, chaotropic salts and other aromatic compounds. • Samples with 260/230 ratios below 1.8 are considered to have a significant amount of these contaminants • Various nanodrop models are available e.gNanodrop 8000, Nanodrop lite and Nanodrop 2000/2000c which is currently available at BecA labs.
Examples of Nano drop readings and interpretation Example 1: RNA sample Interpretation: this sample is suitable for downstream applications
Example 2: RNA Sample Interpretation: Due to the low purity , this sample should be re‐isolated. This reading is not at all reliable due to the contamination.
Exercise: Determine if the below are good quality or not DNA samples
Note that: • Because of the low concentrations, sometimes it is difficult to assess the purity of the samples (esp. RNA) by analyzing the A260/280 and A260/230 ratios. • Quantification cannot be assessed by the NanoDrop because they are outside the lowest concentrations the NanoDrop is designed to measure. • A more sensitive method such as an Agilent Biolanalyzer or Qubit analysis is recommended.
How the Nano drop works: http://phagesdb.org/media/workflow/protocols/pdfs/PHProtocol_NanoDrop.pdf http://www.mlz-garching.de/files/nanodrop_2000_user_manual.pdf https://www.youtube.com/watch?v=FiGZnNs2xXY