Download
1 / 30
300 likes | 452 Views
EEPS ― Small Fish Hg Project. North Bay sites. Treatment Reference Bay Goby. South Bay sites. EEPS ― Small Fish Hg Project. South Bay. South Bay. North Bay. North Bay. Mercury in Central Valley Sport Fish.

E N D
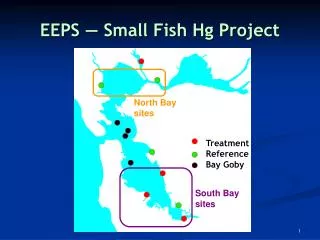
EEPS ― Small Fish Hg Project North Bay sites Treatment Reference Bay Goby South Bay sites
EEPS ― Small Fish Hg Project South Bay South Bay North Bay North Bay
Mercury in Central Valley Sport Fish Letitia Grenier, Aroon Melwani, Jennifer Hunt, Shira Bezalel, and Jay Davis (SFEI) Gary Ichikawa and Billy Jakl (CDFG) Wes Heim and Autumn Bonnema (MLML) Margy Gassel (OEHHA)
Sport Fish Sampling Goals • Characterize mercury concentrations in fish – Goal 1, Objective 3 (SFEI, MLML, CDFG) • Assess the health risks of consuming contaminated fish (OEHHA) • Communicate these risks to appropriate target audiences based on environmental justice principles (EHIB) • Characterize spatial and temporal trends in mercury in fishery resources – Goal 2, Objective 1 (UCD, SFEI, MLML, CDFG) • Determine how habitat restoration and mercury clean-up actions affect methylmercury accumulation in the food web (UCD, SFEI, MLML, CDFG)
Sampling Location Types • Advisory sites • Majority of sites • Data from these sites and all the other site types, including SCVWD and SRWP, will be used to develop consumption advisories and communicate risk to stakeholders (Goal 1) • Popular fishing areas and hatcheries for salmon and trout • Index and intensive sites • Temporal and regional trends in sport fish mercury contamination • Effects of restoration and remediation actions on regional scale • Link sport fish mercury to biosentinel data • Restoration sites • Local effects of restoration
Sampling Locations 2005 • Colors represent different types of sampling sites
Spatial and Temporal Trends • Relative to restoration and remediation actions (none underway yet) • Addressed in the biosentinel report and presentations by Darell Slotton • All sites have been sampled only once • Can examine temporal and regional spatial trends using data at hand from all sites
Relative Impact by Species • Colors represent mercury concentrations • Quadrants represent species • Gray quadrants mean species not collected • Size limits applied, and minimum sample size = 1 fish
Largemouth Bass • Colors are mercury concentration categories • Height of bar represents mean concentration • Size limits applied, and minimum sample size = 1 fish
White Catfish • Colors represent range of mercury concentrations • Height of bar represents concentration • Size limits applied, and minimum sample size = 1 fish
Redear Sunfish • Colors represent range of mercury concentrations • Height of bar represents concentration • Size limits applied, and minimum sample size = 1 fish
Length:mercury Varies by Site • Tremblay (1995, 1998) ANCOVA method for bass and channel catfish • Allows different slopes between sites • Polynomial term allows non-linear relationship • Significant variation within species for intercept, slope, shape of fit (linear or curved)
N Largemouth Bass Spatial Patterns • Mercury mean ± CI estimated for standard length of 350 mm • Using ANCOVA results • Sites from N to S on Y-axis S
Mercury and Wetlands • Main wetland areas near Prospect Slough and Liberty Island • Prospect Slough (intensive) and Sacramento River at Rio Vista (index) sampling sites • Higher mercury than the rest of the Delta • Lower mercury than the rivers • Need more data
N Largemouth Bass Spatial Patterns • Mercury mean ± CI estimated for standard length of 350 mm • Using ANCOVA results • Sites from N to S on Y-axis S
2000 vs. 2005 Largemouth Bass N L L H L L S • Mercury mean ± CI estimated for standard length of 350 mm • Using ANCOVA results
Sacramento River at RM44 • Length:mercury significant • p < 0.0001 • No significant time trend • p = 0.929 • Individuals and composites
Importance of Inter-annual Variation • Inter-annual variation is occurring in the absence of restoration and remediation actions • Therefore, how will we interpret inter-annual variation that may occur during restoration? • BACI design • Long-term time trend monitoring
Progress toward Goals • Goal 2: Characterize spatial and temporal patterns • Mercury higher in the Sacramento and San Joaquin Rivers; lower in the Delta • Wetland areas had mid-level mercury; did not stand out from other sites • No evidence of long-term time trends; few data • Significant inter-annual variation; 2005 lower than 2000
Overall Impact • Colors represent relative mercury contamination • Symbol shapes represent species with highest average concentration • Size limits applied, and minimum sample size = 1 fish
Channel Catfish • Colors represent range of mercury concentrations • Height of bar represents concentration • Size limits applied, and minimum sample size = 1 fish
Channel Catfish Spatial Patterns Few collected in Delta N S • Mercury mean ± CI estimated for standard length of 425 mm • Using ANCOVA results
White Catfish Spatial Patterns Most collected in Delta N S • Mercury mean ± CI • Size limits applied, minimum sample size was 5 fish
Redear Sunfish Spatial Patterns N • Similar overall spatial pattern • Mercury mean ± CI • Size limits applied, minimum sample size was 5 fish S
Spatial Patterns Summary • Lower mercury bioaccumulation in the Delta not well understood • Many hypotheses • E.g.: photodegradation of methylmercury • May occur more readily in the Delta • water velocity low • water clarity and residence time high • (Byington et al. 2005)
Long-term Time Trends • Two sites with sufficient data to examine time trends • Length:mercury regression (p < 0.05) • Regressed residuals on year • Mix of composite and individual data • not the ideal data set
Feather River at Nicolaus • Length:mercury significant • p < 0.0001 • No significant time trend • p = 0.823 • Individuals and composites