Download
1 / 11
110 likes | 180 Views
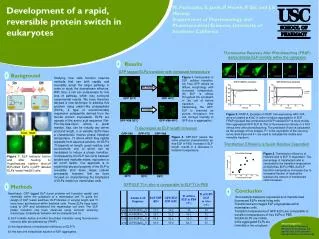
Study on MIPS1 using Confocal microscopy for localization and Immunoprecipitation for protein interaction analysis. Verification of MIPS1 activation and inhibitory effect on ATXR6 activity shown through various experiments.

E N D
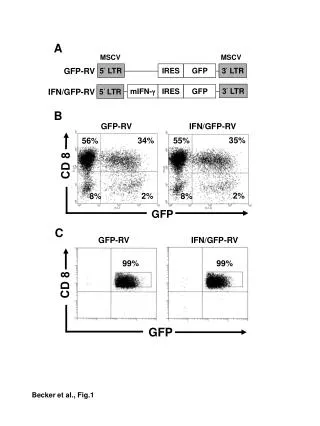
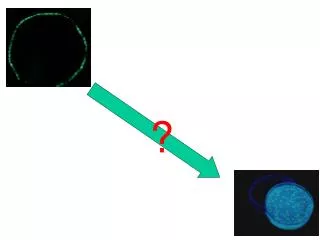
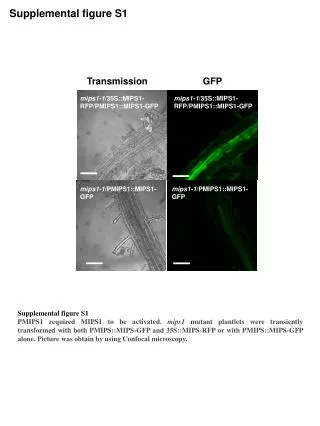
Supplemental figure S1 Transmission GFP mips1-1/35S::MIPS1-RFP/PMIPS1::MIPS1-GFP mips1-1/35S::MIPS1-RFP/PMIPS1::MIPS1-GFP mips1-1/PMIPS1::MIPS1-GFP mips1-1/PMIPS1::MIPS1-GFP • Supplemental figure S1 PMIPS1 required MIPS1 to be activated. mips1 mutant plantlets were transiently transformed with both PMIPS::MIPS-GFP and 35S::MIPS-RFP or with PMIPS::MIPS-GFP alone. Picture was obtain by using Confocal microscopy.
Supplemental figure S2 • Supplemental figure 2:NetNES prediction, which is the output after submission of MIPS1 amino acid sequence. The prediction server calculates the NES score from the HMM and Artificial Neural Network (ANN) scores and all three values are given for each residue.
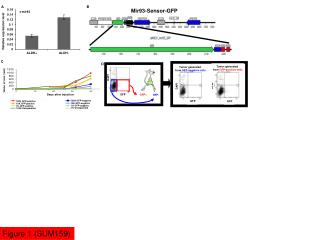
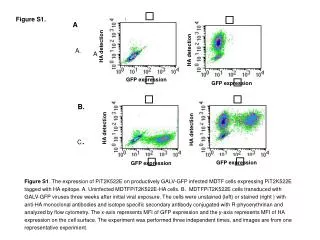
MIPS1::NTF-GFP Supplemental figure S3 transmission GFP A B MIPS1::NTF-GFPRosette leaves MIPS1::NTF-GFP Root Col0 GFP+ GFP+ GFP+ GFP- GFP- GFP- Supplemental figure S3 Distribution of MIPS1 expression in leaf and root tissues. Plants were transformed with a construct allowing the expression of GFP fused to a nuclear envelope targeting signal downstream of the MIPS1 promoter (MIPS1::NTF-GFP). A: Observation of GFP distribution in roots: GFP fluorescence is observed mainly in the stele and in cortical cells close to the vasculature. B: to quantify the proportion of cells expressing MIPS1 in roots and leaves, we used flow-cytometry. Nuclei were extracted in Galbraith buffer, and analyzed using a MoFlo flow cytometre to monitor Propidium Iodide (PI) fluorescence and GFP fluorescence simultaneously. Whole wild-type plants were used as a control to establish the gate for GFP positive nuclei. GFP fluorescence was observed in 30% of root cells, and 95% of leaf cells.
Supplemental figure S4 Col PMIPS1::MIPS1-GFP ATXR6-GST IP GFP IP IgGM IP GST WCL M 80 kD Anti-GFP Anti-GST 50 kD • Supplemental figure S4 MIPS1-GFPandGST-ATXR6interactinvitro.GST-taggedATXR6purifiedfromE.coliwasmixedwithproteinsextractedfromplantsexpressingaMIPS1-GFPfusion.Immunoprecipitationwasperformedusingeitheranti-GFPantibodiesoranti-IgGantibodiesasnegativecontrols,andimmunoprecipitateswereanalyzedwithanti-GFPandanti-GSTantibodies.Aspositivecontrols,werespectivelyusedWCL(wholecelllysate)ofPMIPS1::MIPS1-GFPforMIPS1-GFPandadirectGSTimmunoprecipitationfromtheGST-ATXR6proteinproduction(whitearrowindicatesMIPS1,blackarrowindicatesATXR6).
Supplemental figure S5 A ATXR6 activity ATXR6 activity in arbitrary units ATXR6 quantity B ATXR6 inhibition assay ATXR6 / IP_MIPS1 ATXR6 / IP_IgG ATXR6 activity in arbitrary units Immunoprecipitate quantity Supplemental figure S5 MIPS1 could inhibit ATXR6 activity in vitro. ATXR6 was produced in vitro and we measured specifically its HMT activity alone (A) or supplemented with MIPS1-GFP immunoprecipitated from transgenic plant (B).
Supplemental figure S6 MIPS1 Relative expression Col atrx5/6 mips1-1 Supplemental figure S6: MIPS1mRNA accumulation is decreased in atxr5/6 double mutants. Real-time PCR quantification of the MIPS1 mRNAaccumulation wasperformedusingCol0 and mips1-1 as controls. Errorbars represent sd values from at least threerepetitions.
Supplemental figure S7 - + Zebularine mips1-1 PMIPS1::GUS mips1-1 PMIPS1::GUS • Supplemental figure 7: Spatial expression pattern of MIPS1 promoter in mips1-1 treated or not with zebularine 50µM. Promoter activity was visualized via GUS staining.
Supplemental figure S8 uidA Col PMIPS1::GUS ddm1 PMIPS1::GUS#1 Supplemental figure S8: Real-time PCR quantification of the uidA reporter expression driven by MIPS1 promoter in the wild type and ddm1-2.
Supplemental figure S9 A H3K9ac Col Col+flg22 %of input B H3K27me1 Col Col+flg22 %of input • Supplemental figure S9 • A. AcetylationofH3K9decreasedintheMIPS1promoterafterflg22treatment.H3K9acstateat the wholeMIPS1locuswasanalyzedbyChIPonchromatinextractedfromCol0treatedornotwithflg22usingananti-H3K9acantibody.t.Errorbarsrepresent sd valuesfromatleastthreerepetitions. • B. MethylationofH3K27increasesintheMIPS1promoterafterflg22treatment.H3K27me1stateat the wholeMIPS1locuswasanalyzedbyChIPonchromatinextractedfromCol0treatedornotwithflg22usingananti-H3K27me1antibody.Errorbarsrepresent sd valuesfromatleastthreerepetitions.
Total H3 Col mips1-1 Col+flg22 %of input • Supplemental figure S10 • Total Histone H3 occupancy on MIPS1 locus.The total H3 at the wholeMIPS1locuswasanalyzedbyChIPonchromatinextractedfrom mips1-1 andCol0treatedornotwithflg22usingananti-H3antibody.Errorbarsrepresent sd valuesfromatleastthreerepetitions.