Download
1 / 11
110 likes | 222 Views
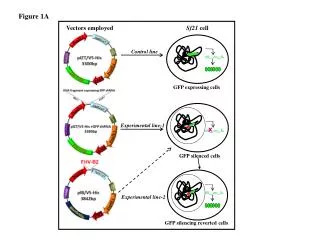
Figure 1A. Vectors employed. Control line. Experimental line-1. Experimental line-2. GFP silencing reverted cells. Sf21 cell. GFP expressing cells. X. GFP silenced cells. Figure 1B. gfp shRNA Forward primer. gfp shRNA (49 bp). a. EcoRI. KpnI. 19 bp. 9 bp. 19 bp. gfp shRNA

E N D
Figure 1A Vectors employed Control line Experimental line-1 Experimental line-2 GFP silencing reverted cells Sf21 cell GFP expressing cells X GFP silenced cells
Figure 1B gfp shRNA Forward primer gfp shRNA (49 bp) a. EcoRI KpnI 19 bp 9 bp 19 bp gfp shRNA Reverse primer 1 2 3 e. i 1 2 3 4 b. 6000 PCR d. f. 1 M 2 1 2 3 4000 1 2 23 nt 2000 c. i RT-PCR 21 nt 0 -actin loading control ii mRNA ii Total RNA loading control 14 kDa iii
Visible Light UV Light Figure 2 A i B 200 160 ii 120 Counts 80 iii 40 0 101 100 102 103 104 FLH-1
Figure 3 FHVB2 expressing line GFP expressing line GFP silencing line 2400 FHVB2- C17 line (i) 1600 800 Relative intensity of siRNA 0 1 2 3 4 (ii) siRNA (iii) Total RNA loading control
Figure 4 A 1 2 3 M kDa C B 15 13 14 15 16 17 18 mAU Catalase 16 14 (i) 1600 1400 160 (ii) 1200 1000 (iii) 110 800 Aldolase 73 600 400 200 E M 1 2 0 0.0 5.0 10.0 15.0 20.0 ml 23mer D 10 11 12 13 14 15 16 17 18 19 20 21 22 23 21mer
Figure 5 A 15 16 Pool W. Probe B 15 i 16 - FHVB2 14 mAU 1600 ii -DCR-1 PAZ 1400 C 1200 10 11 12 13 14 15 16 17 1000 800 18 19 20 21 22 23 +ve 600 400 200 0 0.0 5.0 10.0 15.0 20.0 25.0 ml
Figure 6 A (i) (ii) (iii) (iv) (vi) (v) AD(PAZ) BD(FHV B2) AD(ENDO) BD(FHV B2) pGBKT7 FHVB2 pGADT7+ pGBKT7 pGBKT7 AH109 AD (REP) +BD (REP) pGADT7 SD (Leu-Trp-His-) Scheme YPD SD (Trp-) SD (Leu-) SD (Leu- Trp-) B (ii) (i) INPUT ELUTES FLOW THROUGH I (iii) FT EL M 1 2 3 M 1 2 3 1 2 3 4 M 5 6 116 66 45 35 25 18
Figure 7 A pGAD + pGBD AH109 pGBD (FHVB2) pGAD AD(DCR2PAZ) +BD (FHVB2) AD(Rep)+ BD(Rep) AD (DCR2 PAZ)+ pGBD pGBD (i) Scheme (ii) SD (Leu-Trp-) (iii) SD (Leu-Trp-His-) GST-FHVB2 B MBP MBP-DCR-2-PAZ INPUT FT EL EL FT kDa M 1 2 3 4 5 6 7 118 81 52 36
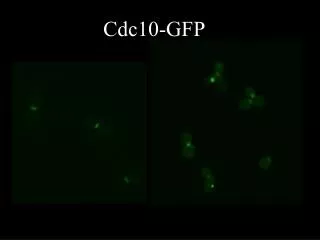
Figure 8 N C A Full Length FHVB2 (107aa) N C FHVB2 – C17 (90aa) B ( ) % ( ) ( ) % % Sf21 cell line GFP expressing GFP silenced C 1.2 1.0 Relative level of gfp mRNA 0.8 0.6 ( ) % ( ) % 0.4 0.2 0 GFP GFP silenced GFP reverted FHVB2- C17 FHVB2- GFP reverted FHVB2- C17 transfected
Figure 9 A AH109 AH109 AD+BD AD+BD AD AD BD(FHV-B2) BD(FHV-B2) AD(PAZ) DCR1+BD (FHVB2) AD(PAZ) DCR1+BD (FHVB2) AD(REP) +BD(REP) AD(REP) +BD(REP) AD- DCR1 (PAZ)+ BD(FHVB2-C17) AD- DCR2 (PAZ)+ BD(FHVB2-C17) BD BD (ii) SD (Leu-Trp-His-) (iii) Scheme (iv) SD (Leu-Trp-His-) (i) Scheme B (i) (ii) INPUT F T ELUTE FT INPUT ELUTE 4 5 M 6 7 1 2 M 3 kDa M 1 2 3 118 81 52 36
Supplementary Figure 1 dm Dicer-1-PAZ dm Dicer-2-PAZ A. dm Dicer-1 dm Dicer-1-PAZ dm Dicer-2-PAZ dm Dicer-1-PAZ dm Dicer-2-PAZ B. 1715 amino acids N-terminal C-terminal dm Dicer-2 dsRNA bd RNase III dsRNA bm HELICASES PAZ MBP-ENDONUCLEASE MBP-PAZ 1710aa 1aa 554aa 659aa 838aa 945aa 1187aa 1642aa 1646aa 535aa MBP-PAZ C. 2249 amino acids N-terminal C-terminal dsRNA bd RNase III HELICASE-C DUF 283 PAZ 2241 2175aa 544aa 510aa 606aa 825aa 920aa 1096 aa 1218 aa 1706 aa 1919 aa aa