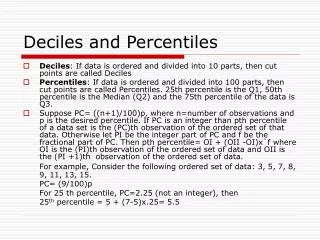
Finding Percentiles
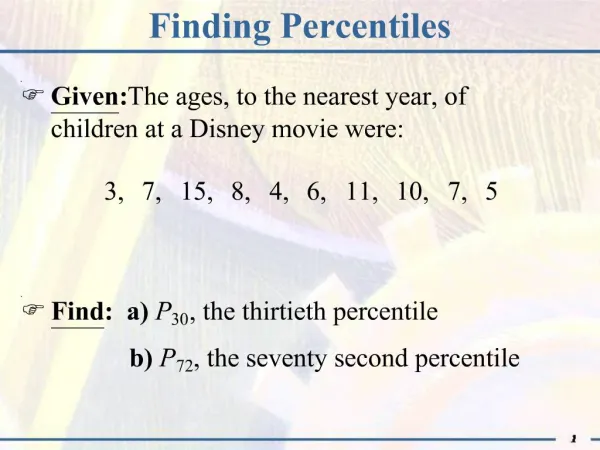
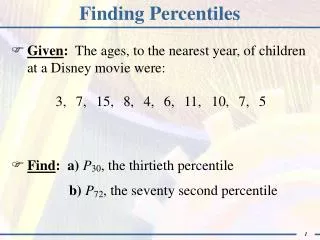
Finding Percentiles. Given : The ages, to the nearest year, of children at a Disney movie were:. 3,. 7,. 15,. 8,. 4,. 6,. 11,. 10,. 7,. 5. Find : a) P 30 , the thirtieth percentile. b) P 72 , the seventy second percentile. The Formula - Part 1. n. nk. k. 100.

Finding Percentiles
E N D
Presentation Transcript
Finding Percentiles • Given: The ages, to the nearest year, of children at a Disney movie were: 3, 7, 15, 8, 4, 6, 11, 10, 7, 5 • Find: a)P30, the thirtieth percentile b)P72, the seventy second percentile
The Formula - Part 1 n nk k 100 • The depth (or position from end) of a percentile requires the use of the formula • n is the “sample size”, the number of data • k is the desired percentile Pk(i.e., P30k = 30)
The Formula - Part 2 nk nk 100 100 • If when calculated does not result in an integer, then d(Pk) = next larger integer • If when calculated results in an integer*, then d(Pk) = (that integer) + 0.5 * “Integer” means calculation results in a whole number (Do you have your sample data ready to use?)
The Procedure - Find P30 Smallest 5th Largest 7th 2nd 4th 9th 8th 6th 3rd Smallest 5th Largest 7th 2nd 4th 9th 8th 6th 3rd Sample data = { } 3 7 15 8 4 6 11 10 7 5 3, 7, 15, 8, 4, 6, 11, 10, 7, 5 nk • Step 2: Find for P30 100 nk nk (10) (30) 300 = 3 3 = = = 100 100 100 100 • Step 1: Rank the data (from smallest to largest) Ranked data = { } 3, 4, 5, 6, 7, 7, 8, 10, 11, 15
The Procedure (Continued) - Find P30 Since , and 3 is an integer, nk That is, P30 is in the 3.5th position = 3 100 • Step 3: Determine the depth of P30, d(P30) d(P30) = 3 + 0.5 = 3.5
The Answer - P30 Ranked data={ } 3, 4, 5, 6, 7, 7, 8, 10, 11, 15 5 6 3.5th position 5 6 + 11 P30 5.5 = = = 2 2 • Step 4: Find P30 by locating the data in the 3.5th position of the ranked data 1st 2nd 3rd 4th 5 6 At most, 30% of the ages are below 5.5 years
The Procedure - Find P72 Sample data = { } 3, 7, 15, 8, 4, 6, 11, 10, 7, 5 Ranked data = { } 3, 4, 5, 6, 7, 7, 8, 10, 11, 15 nk • Step 2: Find for P72 100 nk nk (10) (72) 720 = 7.2 7.2 = = = 100 100 100 100 • Step 1: The data was previously ranked:
The Procedure (Continued) - Find P72 Since , and 7.2 is not an integer, nk That is, P72 is in the 8th position = 7.2 100 • Step 3: Determine the depth of P72, d(P72) d(P72) = 8 (next integer larger than 7.2)
The Answer - P72 Ranked data={ } 3, 4, 5, 6, 7, 7, 8, 10, 11, 15 10 8th position • Step 4: Find P72 by locating the data in the 8th position of the ranked data 1st 2nd 3rd 4th 5th 6th 7th 8th P72 = 10 At most, 72% of the ages are below 10 years
Understanding the Result • Percentiles are a measure of position within a set of data. They provide information on the relative standing of a person or object with respect to the sample taken. If P30 = 5.5, then at most, 30% of the ages are below 5.5 yearsAND at most, 70% of the ages are above 5.5 years If P72 = 10, then at most, 72% of the ages are below 10 yearsAND at most, 28% of the ages are above 10 years * Common mistake: Forgetting to sort the data *