Download
1 / 23
230 likes | 400 Views
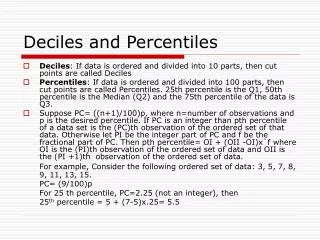
Normal Percentiles. Lecture 26 Section 6.3.1 – 6.3.2 Tue, Mar 2, 2004. Standard Normal Percentiles. Given a value of Z, we know how to find the area to the left of that value of Z. The problem of finding a percentile is exactly the reverse:

E N D
Normal Percentiles Lecture 26 Section 6.3.1 – 6.3.2 Tue, Mar 2, 2004
Standard Normal Percentiles • Given a value of Z, we know how to find the area to the left of that value of Z. • The problem of finding a percentile is exactly the reverse: • Given the area to the left of a value of Z, find that value of Z? • That is, given the percentage, find the percentile.
Standard Normal Percentiles • What is the 90th percentile of Z? • That is, find the value of Z such that the area to the left is 0.9000. • Look up 0.9000 as an entry in the standard normal table. • Read the corresponding value of Z. • Z = 1.28.
Practice • Find the 99th percentile of Z. • Find the 1st percentile of Z. • Find the 50th percentile of Z. • Find Q1 and Q3 of Z. • What value of Z cuts off the top 20%? • What values of Z determine the middle 30%?
Standard Normal Percentiles on the TI-83 • To find a standard normal percentile on the TI-83, • Press 2nd DISTR. • Select invNorm. • Enter the percentile as a decimal (area). • Press ENTER.
Standard Normal Percentiles on the TI-83 • invNorm(0.99) = 2.236. • invNorm(0.01) = -2.236. • invNorm(0.50) = 0. • Q1 = invNorm(0.25) = -0.674. • Q3 = invNorm(0.75) = 0.674. • invNorm(0.80) = 0.8416. • invNorm(0.35) = -0.3853. • invNorm(0.65) = 0.3853.
Normal Percentiles • To find a percentile of a variable X that is N(, ), • Find the percentile for Z. • Use the equation X = + Z to find X.
Example • Let X be N(30, 5). • Find the 95th percentile of X. • The 95th percentile of Z is 1.64. • Therefore, X = 30 + (1.64)(5) = 38.2. • 38.2 is 1.64 standard deviation above average.
Normal Percentiles on the TI-83 • Find the standard normal percentile and use the equation X = + Z. • Or, use invNorm and specify and . • invNorm(0.95, 30, 5) = 38.2.
Uniform Distributions • A uniform distribution is one in which all values within a specified interval are equally likely. • The distribution must be over a bounded interval [a, b]. • That is, it cannot be infinite in either direction. • This distribution is denoted U(a, b).
Uniform Distributions • The graph of U(a, b) is a horizontal straight line. a b
Uniform Distributions • What is the height of the graph? ? a b
Uniform Distributions • The area must be 1, so the height times the width equals 1. ? a b b - a
Uniform Distributions • The height is 1/(b – a). 1/(b – a) a b b - a
Uniform Distributions • Check that the area is 1. 1/(b – a) Area = 1 a b b - a
Uniform Distributions • The mean of U(a, b) is = (a + b)/2, the midpoint of the interval [a, b]. • The standard deviation of U(a, b) is = (b – a)/12, but we won’t need to know that.
Example: Waiting Times • Suppose that a traffic light stays red for exactly 30 seconds before turning green. • You arrive at a “random” moment. • What is the distribution of waiting times? • It ought to be uniform on [0, 30].
Example: Waiting Times • Let X be the waiting time. • Then X is U(0, 30). 1/30 0 30
Example: Waiting Times • What proportion of the time must you wait at least 25 seconds? 1/30 0 30
Example: Waiting Times • What proportion of the time must you wait at least 25 seconds? 1/30 0 25 30
Example: Waiting Times • That is, you must wait from 25 to 30 seconds. 1/30 0 25 30
Example: Waiting Times • Proportion = area = (30 – 25) x (1/30) = 5/30 = 1/6. 1/30 0 25 30
Assignment • Page 341: Exercises 6, 8, 15, 16, 19, 21. • Page 361: Exercises 47, 49, 53, 57, 58, 59, 68, 78.