Percentiles
Percentiles. Corlia van Vuuren February 2011. Definition.

Percentiles
E N D
Presentation Transcript
Percentiles Corlia van Vuuren February 2011
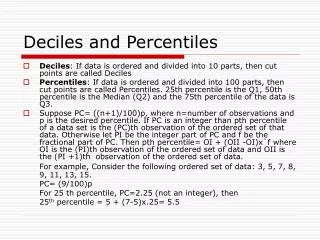
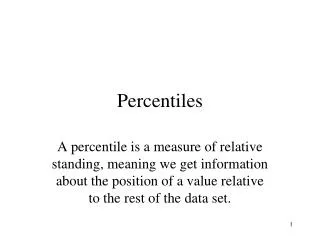
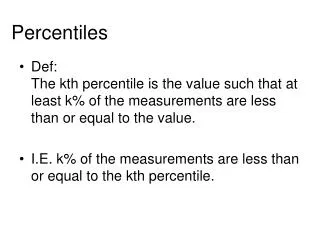
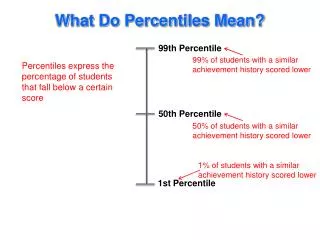
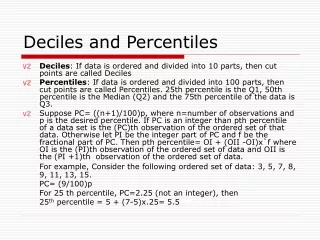
Definition A percentile is a point on a scale below which a certain percentage of scores fall. For example, the 75th percentile is the point in a distribution of scores below which 75 % of scores fall. The 25th percentile is the point below which 25 % of scores fall. The 50th percentile, also called the median (the middlemost score), is the point at which 50 % of scores fall beneath. Therefore, when interpreting your percentile scores, remember that higher is better. If your percentile is around 50, then you are performing better that about half of the database. If your percentile is around 66 or 67, you are performing better than about two-thirds of the database. http://www.healthstreamresearch.com/knowledge/experts/Pages/Percentile.aspx
Calculation Suppose first that X is a continuous variate with strictly increasing cdf P(x). Then the equation P(x) = p 0 [is less than] p [is less than] 1, (2.5.1) has a unique solution, say x = [[Xi].sub.p], which we call the (population) quantile of order p. Thus, [[Xi].sub.1/2] is the median of the distribution. If P(x) is not strictly increasing, P(x) = p may hold in some interval, interval which case any point in the interval would serve as a quantile of order p. When X is discrete [[Xi].sub.p] can still be defined by a generation of (2.5.1.), namely, Pr {X [is less than] [[Xi].sub.p]} [equal to or less than] p [equal to or less than] Pr {[X [equal to or less than] [[Xi].sub.p]}. This gives [[Xi].sub.]\p] uniquely unless the RHS, P([[Xi].sub.p]), equals p, in which case [[Xi].sub.p] again lies in an interval. http://www.questia.com/googleScholar.qst?docId=5001651800
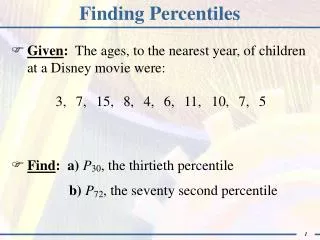
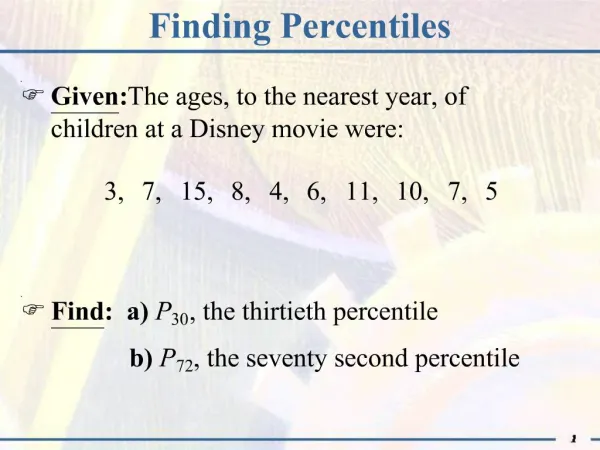
Standardising Percentile values for running sprint field tests in children ages 6-17 years: influence of weight status. Article Excerpt The aim of this study was to provide percentile values for six different sprint tests in 2, 708 Spanish children (1,234 girls) ages 6-17. 9 years. We also examined the influence of weight status on sprint performance across age groups, with a focus on underweight and obese groups. We used the 20-m, 30-m, and 50-m running sprint standing start and running start tests to assess sprint performance. We calculated body mass index (BMI) using and categorized participants according to the BMI international cut-off for underweight, normal weight, overweight, and obese. Boys had significantly better scores than girls in all tests, except for the 30m running sprint standing start and running start tests in the 6-7-year-old group. The underweight group had significantly better scores than their obese counterparts, whereas there were similar levels between underweight and normal weight individuals. The normal weight group showed a significantly better performance than their overweight and obese counterparts. Overweight boys had significantly better performance than their obese counterparts. In conclusion, the percentiles values of six running tests varied by age and gender. The findings indicated that underweight youth did not have poorer sprint performance, and the obese group had lower scores than their leaner counterparts. http://goliath.ecnext.com/coms2/gi_0199-12890510/Percentile-values-for-running-sprint.html
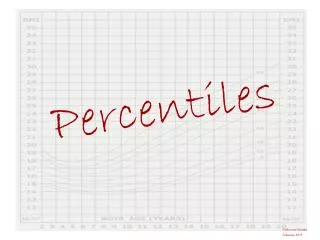
Practical K:\Research\CDCchart.pdf http://www.epi.umn.edu/let/nutri/chobese/img/CDCchart.pdf
Advantages • Straightforward to calculate • Easy to interpret • For communication purposes – the most meaningful transformed scores • Standardised • http://books.google.co.za/books?id=qJDqzWAvbBoC&pg=PA59&lpg=PA59&dq=advantages+of+percentiles&source=bl&ots=I64YpmFH_o&sig=UL7GMeFBJLJ6by8-yFCFufWZH2k&hl=en&ei=yI1kTb4KiIKFB4ClqIUH&sa=X&oi=book_result&ct=result&resnum=7&ved=0CDQQ6AEwBg#v=onepage&q=advantages%20of%20percentiles&f=false
Disadvantages • Can lead to inaccurate conclusions/misleading results • Rectangular distribution, unlike normal bell-shape curve • http://books.google.co.za/books?id=qJDqzWAvbBoC&pg=PA59&lpg=PA59&dq=advantages+of+percentiles&source=bl&ots=I64YpmFH_o&sig=UL7GMeFBJLJ6by8-yFCFufWZH2k&hl=en&ei=yI1kTb4KiIKFB4ClqIUH&sa=X&oi=book_result&ct=result&resnum=7&ved=0CDQQ6AEwBg#v=onepage&q=advantages%20of%20percentiles&f=false
Assignment Find one outcomes measure in Physiotherapy, using percentiles.