Download
1 / 7
70 likes | 220 Views
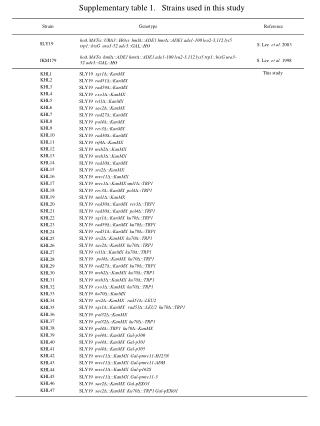
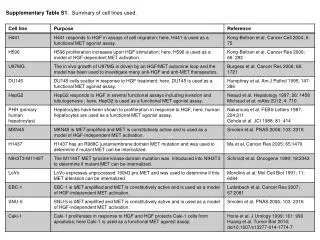
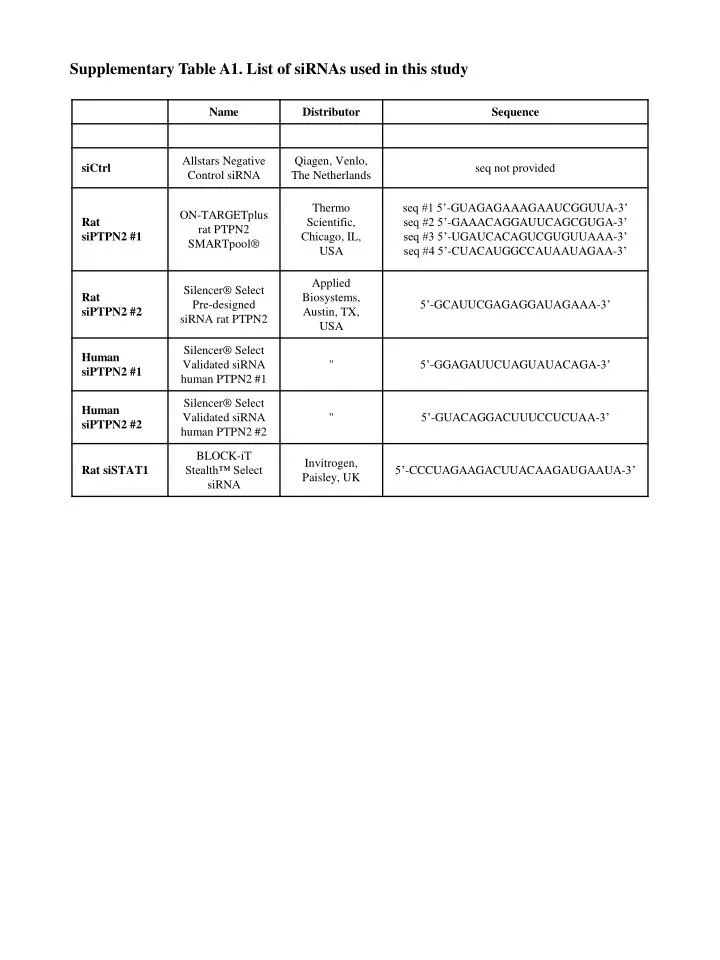
Supplementary Table A1. List of siRNAs used in this study. Supplementary Table A2. List of primers used for real time PCR. Supplementary Table A3. Lysis buffers used for Western blot. Supplementary Table A4. List of antibodies used for Western blot analysis. *. GAPDH. b -actin. srp-14.

E N D
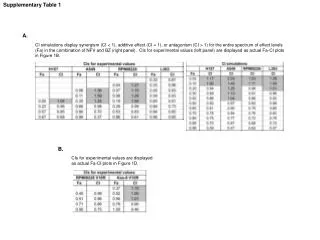
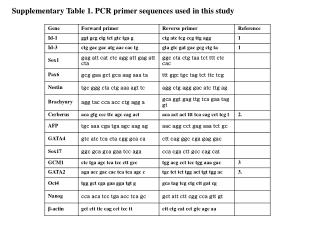
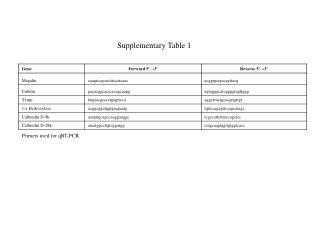
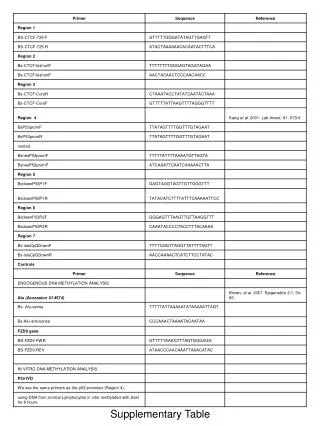
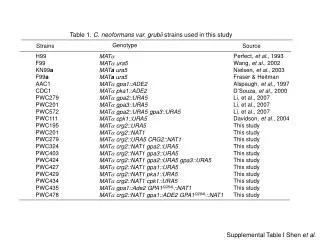
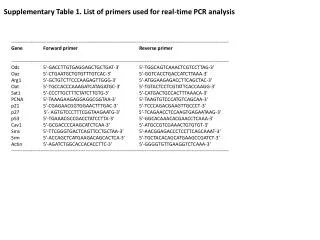
Supplementary Table A2. List of primers used for real time PCR Supplementary Table A3. Lysis buffers used for Western blot
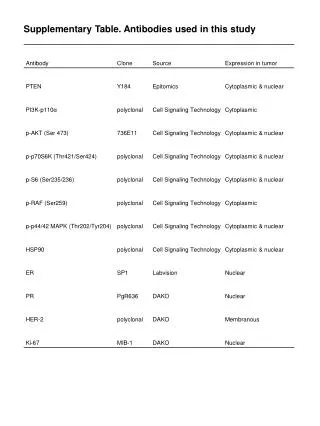
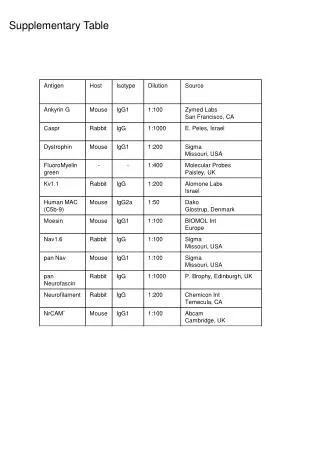
Supplementary Table A4. List of antibodies used for Western blot analysis
* GAPDH b-actin srp-14 Supplementary Figure A1. Comparison between the expression of different housekeeping genes in INS-1E cells. INS-1E cells were left untreated or treated with either IL-1b (100 U/ml) or IL-1b (10 U/ml) + IFN-g (100 U/ml) for 24h. GAPDH, b-actin and srp-14 mRNA expression were assayed by real time PCR. Results are mean ± SEM of 4 independent experiments; * p<0.05 vs untreated cells by Student’s t test. Supplementary Figure A2. PTPN22 is not or poorly expressed in primary FACS-purified rat b-cells, human islets or INS-1E cells. PTPN22 mRNA expression was assayed in the same samples as in Fig. 1 and in rat spleen and lymph nodes, used as positive controls. Results are mean ± SEM of 3-5 independent experiments. N.S., non stimulated controls.
b a a a a Supplementary Figure A3. PTPN2 inhibition does not influence insulin mRNA expression in INS-1E cells. INS-1E were transfected as described in Fig. 3 and left untreated or treated with either IL-1b (100 U/ml), IFN-g (100 U/ml) or IL-1b (10 U/ml) + IFN-g (100 U/ml) for 24h. Insulin 1 and insulin 2 mRNA expression were assayed by RT-PCR and normalized for the housekeeping gene GAPDH. Results are mean ± SEM of 4 independent experiments; * p<0.05, ** p<0.01 and *** p<0.001 vs untreated cells by Student’s t test. ** ** ** ** * *** *** *** Supplementary Figure A4.PTPN2 inhibition does not exacerbate palmitate or CPA-induced cell death in INS-1E cells. INS-1E cells were left untransfected (NT), or transfected with 30 nM of either siCtrl, siPTPN2 #1 or siPTPN2 #2. After 2 days of recovery, cells were left untreated, or treated for 24h with 0.5 mM palmitate, 28 mM glucose, IL-1b (10 U/ml) + IFN-g (100 U/ml) or 25 µM CPA as indicated. The control condition for CPA (DMSO) contained a similar dilution of DMSO. Apoptosis was evaluated using HO/PI staining. Results are mean ± SEM of 4 experiments; a: p<0.001 vs untreated NT or untreated transfected with the same siRNA; b: p<0.001 vs IL-1b + INF-g-treated NT & siCtrl; ANOVA followed by Student’s t test with Bonferroni correction.
A IL + IFN IL + IFN siPTPN2 #1 siPTPN2 #1 siPTPN2 #1 siPTPN2 #1 siPTPN2 #1 siPTPN2 #1 siPTPN2 #1 siPTPN2 #1 siPTPN2 #1 siPTPN2 #1 siPTPN2 #1 siPTPN2 #1 siPTPN2 #1 siPTPN2 #1 siPTPN2 #1 siPTPN2 #1 siPTPN2 #1 siPTPN2 #1 siPTPN2 #2 siPTPN2 #2 siPTPN2 #2 siPTPN2 #2 siPTPN2 #2 siPTPN2 #2 siPTPN2 #2 siPTPN2 #2 siPTPN2 #2 siPTPN2 #2 siPTPN2 #2 siPTPN2 #2 siPTPN2 #2 siPTPN2 #2 siPTPN2 #2 siPTPN2 #2 siPTPN2 #2 siPTPN2 #2 siCtrl siCtrl siCtrl siCtrl siCtrl siCtrl siCtrl siCtrl siCtrl siCtrl siCtrl siCtrl siCtrl siCtrl siCtrl siCtrl siCtrl siCtrl NT NT NT NT NT NT NT NT NT NT NT NT NT NT NT NT NT NT - - - 4h 4h 15’ 30’ 14h 14h 30’ 30’ 1’ 1h 24h 5’ 24h 2h 2h phospho-ERK PTPN2 ERK a-TUBULIN B EGF phospho-EGFR EGFR PTPN2 a-TUBULIN PTPN2 a-TUBULIN C phospho-IRb IRb Supplementary Figure A5.siRNA-mediated PTPN2 knockdown does not influence ERK or EGFR phophorylation, but increases IRb phosphorylation. INS-1E cells were left untransfected (NT), or were transfected with 30 nM of either siCtrl, siPTPN2 #1 or siPTPN2 #2. After 2 days of recovery, cells were left untreated, or treated for different time points with IL-1b (10 U/ml) + IFN-g (100 U/ml) or rrEGF (100 ng/ml) as indicated. (A) phospho-ERK and total ERK; (B) phosphor-EGFR and total EGFR; (C) phospho-IRb and total IRb were evaluated by Western blot. PTPN2 and a-tubulin proteins were probed to ascertain accurate inhibition and equal loading respectively. Each result is representative of 4 independent experiments.
a,e,f a,g,h a a a,c,d a,e g a b Supplementary Figure A6.Double knockdown of PTPN2 (by two different siRNAs) and STAT1 protects INS-1E cells from cytokine-induced apoptosis. INS-1E cells were left untransfected (NT), or were transfected with 60 nM of a control siRNA (siCtrl) or with 30 nM of either a pool of siRNAs targeting PTPN2 (siPTPN2), or another siRNA targeting PTPN2 (siPTPN2 #2), or a siRNA targeting STAT1 (siSTAT1), or double transfected with 30 nM of both siPTPN2 and siSTAT1, or siPTPN2 #2 and siSTAT1. After 2 days of recovery, cells were left untreated, or treated for 24h with IFN-g (100 U/ml), IL-1b (10 U/ml) + IFN-g (100 U/ml) or TNF-a (1000 U/ml) + IFN-g (100 U/ml). Apoptosis was then evaluated using HO/PI staining. Results are mean ± SEM of 4 independent experiments; a: p<0.001 and b: p<0.01 vs untreated NT or untreated transfected with the same siRNA; c: p<0.001 vs IFN-g-treated NT & siCtrl; d: p<0.001 vs IFN-g-treated siSTAT1, siPTPN2 + siSTAT1 & siPTPN2 #2 + siSTAT1; e: p<0.001 vs IL-1b + INF-g-treated NT & siCtrl; f: p<0.001 vs IL-1b + INF-g-treated siSTAT1, siPTPN2 + siSTAT1 & siPTPN2 #2 + siSTAT1; g: p<0.001 vs TNF-a + INF-g-treated NT & siCtrl; h: p<0.001 vs TNF-a + INF-g-treated siSTAT1, siPTPN2 + siSTAT1 & siPTPN2 #2 + siSTAT1; ANOVA followed by Student’s t test with Bonferroni correction.