1 / 1

Supplementary Table 1

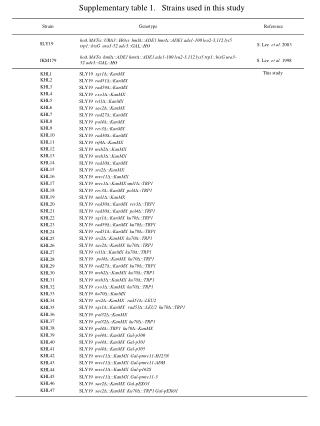
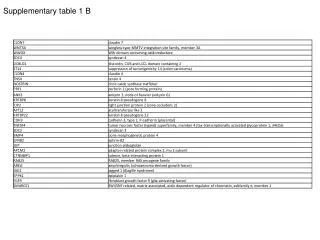
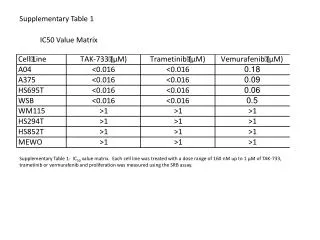
Supplementary Table 1. IC50 Value Matrix. Supplementary Table 1: IC 50 value matrix. Each cell line was treated with a dose range of 160 nM up to 1 µM of TAK-733, trametinib or vermurafenib and proliferation was measured using the SRB assay.

Download Presentation

Supplementary Table 1

An Image/Link below is provided (as is) to download presentation Download Policy: Content on the Website is provided to you AS IS for your information and personal use and may not be sold / licensed / shared on other websites without getting consent from its author. Content is provided to you AS IS for your information and personal use only. Download presentation by click this link. While downloading, if for some reason you are not able to download a presentation, the publisher may have deleted the file from their server. During download, if you can't get a presentation, the file might be deleted by the publisher.

E N D

Presentation Transcript


  1. Supplementary Table 1 IC50 Value Matrix Supplementary Table 1: IC50 value matrix. Each cell line was treated with a dose range of 160 nM up to 1 µM of TAK-733, trametinib or vermurafenib and proliferation was measured using the SRB assay.

More Related