Download
1 / 9
90 likes | 258 Views
Primer name. Sequence 5`-3`. Accession Number. ChiF. ACCAAGCTACTCGCAAGAGG. CD485880. ChiR. CGGAAGCGCAGTAAGATGA. GluF. CATTGATATGACCTTGATCG. CD486342. GluR. GTGAGATATCCCTTGGATTG. PR1F. TGCCCAAGACTCACAACAAG. CK988133.1 (Patil et al. 2005). PR1R. GGCCTTCTCATTAACCCACA. Hist3F.

E N D
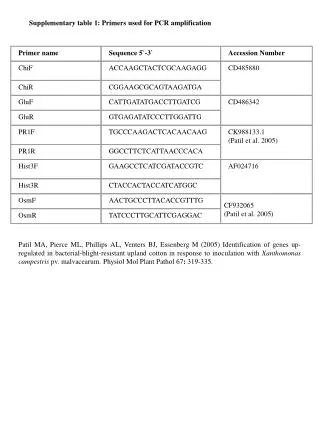
Primer name Sequence 5`-3` Accession Number ChiF ACCAAGCTACTCGCAAGAGG CD485880 ChiR CGGAAGCGCAGTAAGATGA GluF CATTGATATGACCTTGATCG CD486342 GluR GTGAGATATCCCTTGGATTG PR1F TGCCCAAGACTCACAACAAG CK988133.1 (Patilet al. 2005) PR1R GGCCTTCTCATTAACCCACA Hist3F GAAGCCTCATCGATACCGTC AF024716 Hist3R CTACCACTACCATCATGGC OsmF AACTGCCCTTACACCGTTTG CF932065 (Patilet al. 2005) OsmR TATCCCTTGCATTCGAGGAC Supplementarytable 1: Primers used for PCR amplification Patil MA, Pierce ML, Phillips AL, Venters BJ, Essenberg M (2005) Identification of genes up-regulated in bacterial-blight-resistant upland cotton in response to inoculation with Xanthomonas campestris pv. malvacearum. Physiol Mol Plant Pathol 67: 319-335.
Supplementary Fig 1 Semi-quantitative Reverse Transcriptase-PCR analysis showing AtNPR1 transcript accumulation in T2and T3 generations of transgenic cotton.
a b Supplementary Fig 2 (a) Southern blot analysis on genomic DNA from transgenic cotton lines expressing AtNPR1. DNA was digested with EcoR1 and probed with P32 labeled fragment of the AtNPR1 gene. (b) Map of AtNPR1 gene construct that was used to generate transgenic cotton.
** a * * b Supplementary Fig 3 Salicylic acid (SA)-induced (a) Chitinase and (b) Glucanase activities in the cotyledons of transgenic cotton line, 68L-19 following treatment of the roots with 3 mM SA. Roots of two-day old pre-germinated seedlings were treated with 3 mM SA and the cotyledons were harvested at different time points for enzyme activity analyses. Data represent mean±SE (n=10); the induced enzyme activity value for the transgenic line is significantly higher than that of the WT value at *P<0.05; **P<0.01.
*** a *** b Supplementary Fig 4 Salicylic acid (SA)-induced (a) Chitinase and (b) Glucanase activities in the cotyledons of transgenic cotton line, 68L-20, following treatment of the roots with 3 mM SA for 24 h. Data represent mean ±SE (n=10); the induced enzyme activity values for the transgenic line is significantly higher than that of the WT value at ***P<0.001.
68L-19 WT DP444 * * b a c Supplementary Fig 5 Resistance to Fusarium oxysporum f. sp. vasinfectum (Isolate Fov11) in transgenic cotton line, 68L-19 expressing AtNPR1. Non-transgenic Coker 312 plants (WT) were used as control and a Fusarium wilt-resistant, commercial cotton variety (DP 444) was used for comparison. Two parameters were used to score the effects of infection, three weeks following the inoculation of roots; (a) Shoot weight, and (b) Leaf disease index. Data represent mean ±SE, *P<0.05, n=12. (c) Photographs of various sets of plants showing their relative state before scoring for disease severity.
68L-19 WT Supplementary Fig 6 Longitudinal section showing vascular browning in the stem (5th internode) of cotton plant at three weeks following inoculation with Verticillium dahliae (isolate TS2).
* * ** ** b a * * d c Supplementary Fig 7 Resistance to reniform nematode, Rotylenchulus reniformis, in transgenic cotton lines expressing AtNPR1. (a) Nematode count in soil after 10 weeks of inoculation, (b) Number of bolls per plant, (c) Boll weight per plant, (d) Boll position (Number of bolls at given nodes in 10 plants). Data represent mean ±SE, *P<0.05; **P<0.01, n=10. Note that on the 5th day after inoculation, due to the equipment break down, the temperature in the growth chamber rose to 42oC for several hours and the plants were transferred to and maintained in a greenhouse for four days before returning to the chamber for growth under controlled conditions until completion of the experiment. Also, note that the final nematode count in this experiment is substantially higher compared to what is presented for the experiment described in the main text. These high numbers are not unusual and have been reported previously for reniform nematodes (Agudelo et al. 2005). The large differences between two experiments can easily result from small variability in the number of reproductive cycles completed. Agudelo P, Robbins RT, Kim KS, Stewart MJ. 2005. Histological changes in Gossypium hirsutum associated with reduced reproduction of Rotylenchulus reniformis. J Nematol 37:185 - 189.
WT 68L-19 Supplementary Fig 8 Resistance to reniform nematodes (Rotylenchulus reniformis). Transgenic and WT plants at 10 weeks following the inoculation of soil with reniform nematodes. The photograph was taken before scoring the results that are presented in Supplementary Fig. 7a-d.