Download

1 / 9
90 likes | 200 Views
State Financing of Higher Education: The Annual SHEEO Survey. Fundamental Questions. W hat is the state’s participation rate in higher ed? W hat is each state’s relative capacity for supporting higher education through tax revenues?

E N D
State Financing of Higher Education: The Annual SHEEO Survey
Fundamental Questions What is the state’s participation rate in higher ed? What is each state’s relative capacity for supporting higher education through tax revenues? What is the comparative extent of state support? And how is it distributed? What do families contribute? What is the total per student funding for the instructional function in each state?
Sheeo’s Plan Preserving and expanding trend capability of Halstead’s survey Complete data collection from FY99-present New analysis from greater data collection Clear presentation of results Eliminate confusing and inconsistent terminology Graphical analysis of state, national & historical trends Currently receiving completed surveys Publish this fall
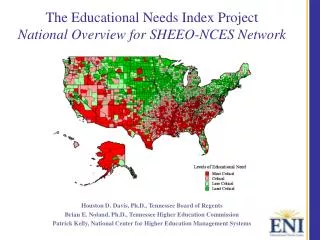
Interstate Comparisons • Halstead’s survey used an indexing system, called the System Support Index, to allow for interstate comparisons. • The System Support Index adjusted fordifferences in the cost of living and mix of institutional types. • SHEEO is revisiting ways of indexing state data by looking at various ways to adjust for: • cost of living comparisons • institutional mixcomparisons
Cost of Living Comparisons Statewide cost of living Metropolitan average & rural average Counties with higher education institutions
Institutional Mix Comparisons Carnegie 2000 Classifications as is Carnegie segmented by size Factor/Cluster Analysis alone
Population State population from U.S. Census Bureau High School Graduates Collected from the SHEFOs First Time Freshman Collected from IPEDS FTE Enrollment Collected from the SHEFOs State and Local Government Appropriations Collected from the SHEFOs Tuition Revenues Collected from the SHEFOs Median Income State median income of households from the U.S. Census Bureau Raw Data
Collected Tax Revenue State and local government tax collections from the Governments Division, U.S. Census Bureau Adjustment: Projected using previous data and projection rate(ex: 96 x ( ((95/94) + (96/95))/2)) = 98) Taxable Resources Potential taxable sources: TTR = taxable portions of the Gross State Product plus • income from out-of-state sources • income from out-of-state state residents • select federal $ • net realized capital gains From the Office of Economic Policy, U.S. Department of Treasury Adjustment: State TTR x US collected tax revenue per capita x State Pop = Tax Capacity or Total Taxable Revenues(Halstead) Raw Data
Productivity State Tax Effort Student Source System Relative Size x = Wealth Rel. to Enroll Tax Res Rel. to Enroll Family Share of Funding State Total Taxable Resources Tuit FTE x Med. Inc. Tuit SL-R App + Tuit SL-R App + Tuit FTE Tax Coll Taxbl Rev Tax Res Pop Tax Coll Taxbl Rev Tuit FTE Tax Coll Pop FTE Pop Tax Coll FTE FTE Pop HS Grad Pop Tax Coll Pop Tax Coll Taxbl Rev Tax Coll Pop Tabl Rev FTE FTE Pop Tax Res Pop SL-R App Tax Coll Taxbl Rev Pop FTE Enroll HS Grad FTE Pop HS Grad Pop FTE Enroll HS Grad SL-R App FTE SL-R App FTE = = State Tax Wealth State Payment Priority x = State Appropriations State + Local – RAM Approp Tax Coll x = Total Funding Family Effort Tuition Revenues Tuit SL-R App + Tuit SL-R App Taxbl Rev SL-R App Tax Coll x Tuit SL-R App + Tuit Tuit SL-R App + Tuit Tuit SL-R App + Tuit = Overall Funding Effort 1– x = = SL-R App + Tuit Taxbl Rev 1– 1– Formulas