Download
1 / 17
170 likes | 290 Views
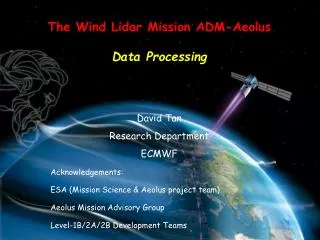
Lars Peter Riishojgaard 1,2 , Zaizhong Ma 1,2 , Michiko Masutani 3 , Jack Woollen 3, Dave Emmitt 4 , Sid Wood 4 , Steve Greco 4 1 Joint Center for Satellite Data Assimilation 2 University of Maryland Baltimore County 3 NCEP Environmental Modeling Center 4 Simpson Weather Associates.

E N D
Lars Peter Riishojgaard1,2, Zaizhong Ma1,2, Michiko Masutani3, Jack Woollen3, Dave Emmitt4, Sid Wood4, Steve Greco4 1Joint Center for Satellite Data Assimilation 2University of Maryland Baltimore County 3NCEP Environmental Modeling Center 4Simpson Weather Associates Perspectives on the initial results of the OSSSE’s for a US Wind Lidar space mission Lidar Working Group, Miami, February 8-9 2011
Overview • NWP and wind observations • OSSE setup • Interpretation of initial results • A word about observation errors • Possible future directions • Summary and conclusions Lidar Working Group, Miami, February 8-9 2011
500 hPa anomaly correlation coefficients, NH w4-9 w0-3 w10-20 Lidar Working Group, Miami, February 8-9 2011
500 hPa anomaly correlation coefficients, SH w4-9 w0-3 w10-20 Lidar Working Group, Miami, February 8-9 2011
Should the LWG (or anyone else) be pleased with a one-point improvement? • (Experiments still run at low resolution, so there is hope that results will improve) • However, before attempting to answer this, one may want to consider: • Economic value of weather forecasting • General rate of progress in NWP • Implications for other measures of skill • Impact of other observing systems Lidar Working Group, Miami, February 8-9 2011
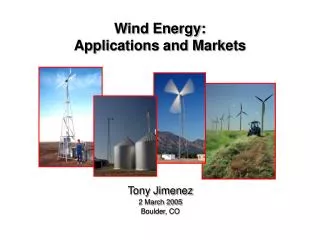
I. Economic value of weather forecasting • Department of Commerce: “20% of overall US economy is weather sensitive”: ~$3 trillion/year • Impact to air and surface transportation, agriculture, construction, energy production and distribution, etc. • Assume that half of this is “forecast sensitive”: $1.5 trillion/year Lidar Working Group, Miami, February 8-9 2011
Value of weather forecasting (II) • Assume that the potential savings due to weather forecasting amount to 5% of the “forecast sensitive total”: ~$75B/year • Assume that the savings are distributed linearly over the achieved forecast range for the global NWP system: • 0 h useful forecast range => $0 in savings • 336 h useful forecast range => $75B in savings • This implies that the value to the United States economy of NWP is >200M per hour of forecast range per year! Lidar Working Group, Miami, February 8-9 2011
II. Overall rate of progress in NWP skill Day-5 AC increase of 10 points over 15 years. Rate of progress is ~0.7 points/year Lidar Working Group, Miami, February 8-9 2011
In the latter part of the useful forecast range the AC score drops by roughly 15 points over 48 hours, or ~0.3 points/hour Lidar Working Group, Miami, February 8-9 2011
Slide from Lord and Yang, EMC III. Impact on other measures of skill • Look at the history of extremes in the distribution • Scores <0.7 (dropout criterion) • Excellent forecasts (>0.9)
Slide from Lord and Yang, EMC Percentage of Poor (Busted) Forecasts 1999: Mean AC score ~.75 A four-point increase was associated with cutting the frequency of bust in half! 2001: Mean AC score ~.79
4th WMO Impact Workshop (Geneva, May 2008) Overall impact (“marginal skill”) on short/medium range global NWP CBS TECO, Windhoek, Namibia
“Why does each observing system contribute so relatively little?” • Marginal skill is very different from initial skill! • Several observing systems (e.g. RAOBS, AMSU, AIRS, SATWINDS, AMDAR) could probably provide the first three days of skill on their own • (e.g. ECWMF have shown that they can run somewhat skilful 4D-VAR forecasts using surface pressure observations alone) • Extending the useful range in the presence of all the existing components of the GOS is far more difficult than providing skill in the first part of the range! Lidar Working Group, Miami, February 8-9 2011
What is one NH point worth? • A one-point increase corresponds to the average total progress in skill over 18 months due to ALL factors (improvements in model and data assimilation algorithms, horizontal and vertical resolution, computing, and all components of the global observing system) • It represents an extension of the useful forecast range by ~3h • This is arguably worth $600M/year to the US economy • It can have a significant impact on frequency of busts Lidar Working Group, Miami, February 8-9 2011
Future plans JCSDA alone • Increased horizontal resolution (T-382 and higher) • Detailed case studies • Separate assessments of the impacts of Direct Detection and Coherent Detection • Impact of one, two or four telescopes on spacecraft • Impact on applications other than NWP, e.g. chemical transport models • Impact of and methodology for observation error assignment SWA involvement • Extend simulation into hurricane season (several Atlantic hurricanes in Nature Run “Oct 2005”) • Experiment in opposite season (NH winter/SH summer) • Other orbits, e.g. different altitude, lower inclination Lidar Working Group, Miami, February 8-9 2011
An estimate of LIDAR observation error from several points of view Estimate of lidar observation error from theoretical arguments. See Lorenc,A.C., Graham,R.J., Dharssi,I., MacPherson,B., Ingleby,N.B., Lunnon,R.W.,1992, Preparation for the use of a Doppler wind lidar information in meteorological assimilation systems, ESA-CR(P)-3454 Practical estimates of lidar observation errors from fits to an assimilation of those data. This field represents a lower bound of the observation error, including representativeness, if the assimilation is “efficient” in filtering signal from the observations (Lorenc,1981, Hollinsworth and Lonnberg, 1985). The test assimilation at t126 (~140km grid) would generate a theoretical average ob error of ~ 2.4m/s, which agrees reasonably well with the estimate of lower bounds of the error from the (o-a) field. Lidar Working Group, Miami, February 8-9 2011
Summary and conclusions • The initial T-126 experiments using a simulated GWOS on top of the existing (2005) Global Observing System indicate the following impact: • 1-point improvement in the NH 5-day 500 hPa ACC • 2-point improvement in the SH 5-day 500 hPa ACC • The SH and tropical impacts are very good • Even the NH impact would be very significant if it were to hold up in future tests (and yes, we should be pleased about it!) • Results from additional studies and higher resolution experiments eagerly anticipated Lidar Working Group, Miami, February 8-9 2011