Download
1 / 1
10 likes | 85 Views
Princess Ngonnso ´ and the foundation of the royal house of Nso ´. Genetics in support of Oral History. K. R. Veeramah, D. Zeitlyn, V. G. Fanso, B. A. Connell, M. E. Weale, N. Bradman and M. G. Thomas. The Centre for Genetic Anthropology, Department of Biology, University College London.

E N D
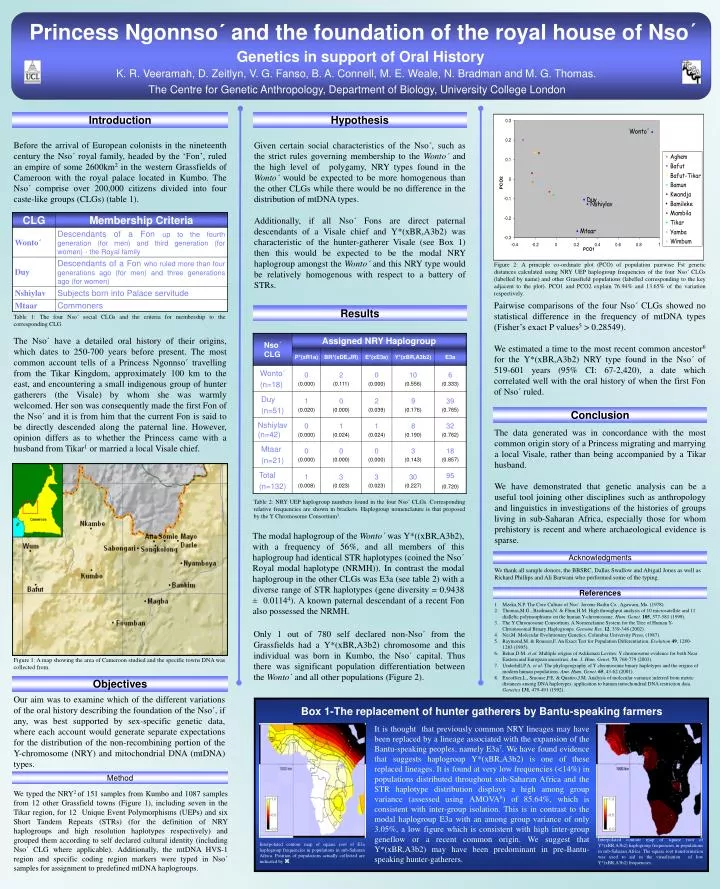
Princess Ngonnso´ and the foundation of the royal house of Nso´ Genetics in support of Oral History K. R. Veeramah, D. Zeitlyn,V. G. Fanso, B. A. Connell, M. E. Weale, N. Bradman and M. G. Thomas. The Centre for Genetic Anthropology, Department of Biology, University College London Introduction Hypothesis Before the arrival of European colonists in the nineteenth century the Nso´ royal family, headed by the ‘Fon’, ruledan empire of some 2600km2in the western Grassfields of Cameroon with the royal palace located in Kumbo. The Nso´ comprise over 200,000 citizens divided into four caste-like groups (CLGs) (table 1). Given certain social characteristics of the Nso´, such as the strict rules governing membership to the Wonto´ and the high level of polygamy, NRY types found in the Wonto´ would be expected to be more homogenous than the other CLGs while there would be no difference in the distribution of mtDNA types. Additionally, if all Nso´ Fons are direct paternal descendants of a Visale chief and Y*(xBR,A3b2) was characteristic of the hunter-gatherer Visale (see Box 1) then this would be expected to be the modal NRY haplogroup amongst the Wonto´ and this NRY type would be relatively homogenous with respect to a battery of STRs. Figure 2: A principle co-ordinate plot (PCO) of population pairwise Fst genetic distances calculated using NRY UEP haplogroup frequencies of the four Nso´ CLGs (labelled by name) and other Grassfield populations (labelled corresponding to the key adjacent to the plot). PCO1 and PCO2 explain 76.94% and 13.65% of the variation respectively. Pairwise comparisons of the four Nso´ CLGs showed no statistical difference in the frequency of mtDNA types (Fisher’s exact P values5 > 0.28549). We estimated a time to the most recent common ancestor6 for the Y*(xBR,A3b2) NRY type found in the Nso´ of 519-601 years (95% CI: 67-2,420), a date which correlated well with the oral history of when the first Fon of Nso´ ruled. Results Table 1: The four Nso´ social CLGs and the criteria for membership to the corresponding CLG. The Nso´ have a detailed oral history of their origins, which dates to 250-700 years before present. The most common account tells of a Princess Ngonnso´ travelling from the Tikar Kingdom, approximately 100 km to the east, and encountering a small indigenous group of hunter gatherers (the Visale) by whom she was warmly welcomed. Her son was consequently made the first Fon of the Nso´ and it is from him that the current Fon is said to be directly descended along the paternal line. However, opinion differs as to whether the Princess came with a husband from Tikar1 or married a local Visale chief. Conclusion The data generated was in concordance with the most common origin story of a Princess migrating and marrying a local Visale, rather than being accompanied by a Tikar husband. We have demonstrated that genetic analysis can be a useful tool joining other disciplines such as anthropology and linguistics in investigations of the histories of groups living in sub-Saharan Africa, especially those for whom prehistory is recent and where archaeological evidence is sparse. Table 2: NRY UEP haplogroup numbers found in the four Nso´ CLGs. Corresponding relative frequencies are shown in brackets. Haplogroup nomenclature is that proposed by the Y Chromosome Consortium3. The modal haplogroup of the Wonto´ was Y*((xBR,A3b2), with a frequency of 56%, and all members of this haplogroup had identical STR haplotypes (coined the Nso´ Royal modal haplotype (NRMH)). In contrast the modal haplogroup in the other CLGs was E3a (see table 2) with a diverse range of STR haplotypes (gene diversity = 0.9438 ± 0.01144). A known paternal descendant of a recent Fon also possessed the NRMH. Acknowledgments We thank all sample donors, the BBSRC, Dallas Swallow and Abigail Jones as well as Richard Phillips and Ali Barwani who performed some of the typing. References • Mzeka,N.P. The Core Culture of Nso'. Jerome Radin Co., Agawam, Ma. (1978). • Thomas,M.G., Bradman,N. & Flinn,H.M. High throughput analysis of 10 microsatellite and 11 diallelic polymorphisms on the human Y-chromosome. Hum. Genet.105, 577-581 (1999). • The Y Chromosome Consortium. A Nomenclature System for the Tree of Human Y-Chromosomal Binary Haplogroups. Genome Res.12, 339-348 (2002). • Nei,M. Molecular Evolutionary Genetics. Columbia University Press, (1987). • Raymond,M. & Rousset,F. An Exact Test for Population Differentiation. Evolution49, 1280-1283 (1995). • Behar,D.M. et al. Multiple origins of Ashkenazi Levites: Y chromosome evidence for both Near Eastern and European ancestries. Am. J. Hum. Genet.73, 768-779 (2003). • Underhill,P.A. et al. The phylogeography of Y chromosome binary haplotypes and the origins of modern human populations. Ann. Hum. Genet.65, 43-62 (2001). • Excoffier,L., Smouse,P.E. & Quattro,J.M. Analysis of molecular variance inferred from metric distances among DNA haplotypes: application to human mitochondrial DNA restriction data. Genetics131, 479-491 (1992). Only 1 out of 780 self declared non-Nso´ from the Grassfields had a Y*(xBR,A3b2) chromosome and this individual was born in Kumbo, the Nso´ capital. Thus there was significant population differentiation between the Wonto´ and all other populations (Figure 2). Figure 1: A map showing the area of Cameroon studied and the specific towns DNA was collected from. Objectives Our aim was to examine which of the different variations of the oral history describing the foundation of the Nso´, if any, was best supported by sex-specific genetic data, where each account would generate separate expectations for the distribution of the non-recombining portion of the Y-chromosome (NRY) and mitochondrial DNA (mtDNA) types. Box 1-The replacement of hunter gatherers by Bantu-speaking farmers It is thought that previously common NRY lineages may have been replaced by a lineage associated with the expansion of the Bantu-speaking peoples, namely E3a7. We have found evidence that suggests haplogroup Y*(xBR,A3b2) is one of these replaced lineages. It is found at very low frequencies (<14%) in populations distributed throughout sub-Saharan Africa and the STR haplotype distribution displays a high among group variance (assessed using AMOVA8) of 85.64%, which is consistent with inter-group isolation. This is in contrast to the modal haplogroup E3a with an among group variance of only 3.05%, a low figure which is consistent with high inter-group geneflow or a recent common origin. We suggest that Y*(xBR,A3b2) may have been predominant in pre-Bantu-speaking hunter-gatherers. Method We typed the NRY2 of 151 samples from Kumbo and 1087 samples from 12 other Grassfield towns (Figure 1), including seven in the Tikar region, for 12 Unique Event Polymorphisms (UEPs) and six Short Tandem Repeats (STRs) (for the definition of NRY haplogroups and high resolution haplotypes respectively) and grouped them according to self declared cultural identity (including Nso´ CLG where applicable). Additionally, the mtDNA HVS-1 region and specific coding region markers were typed in Nso´ samples for assignment to predefined mtDNA haplogroups. Interpolated contour map of square root of Y*(xBR,A3b2) haplogroup frequencies in populations in sub-Saharan Africa. The square root transformation was used to aid in the visualisation of low Y*(xBR,A3b2) frequencies. Interpolated contour map of square root of E3a haplogroup frequencies in populations in sub-Saharan Africa. Position of populations actually collected are indicated by .