Download
1 / 1
10 likes | 90 Views
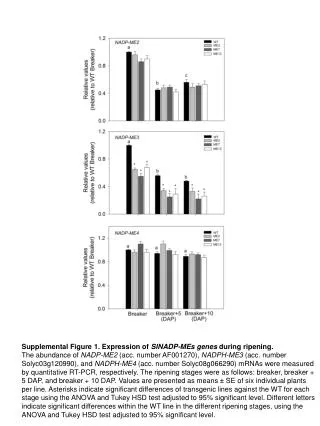
This figure illustrates the abundance of NADP-ME2, NADPH-ME3, and NADPH-ME4 mRNAs in tomatoes at different ripening stages (breaker, breaker + 5 DAP, and breaker + 10 DAP). Data was obtained using quantitative RT-PCR, with values presented as means ± SE of six plants per line. Asterisks denote significant differences of transgenic lines against the WT at each stage. Different letters indicate significant differences within the WT line across ripening stages. Statistical analysis was performed using ANOVA and Tukey HSD test adjusted to 95% significance level.

E N D
Supplemental Figure 1. Expression of SlNADP-MEs genesduring ripening. The abundance of NADP-ME2(acc. number AF001270),NADPH-ME3(acc. number Solyc03g120990), and NADPH-ME4(acc. number Solyc08g066290) mRNAs were measured by quantitative RT-PCR, respectively. The ripening stages were as follows: breaker, breaker + 5 DAP, and breaker + 10 DAP. Values are presented as means ± SE of six individual plants per line. Asterisks indicate significant differences of transgenic lines against the WT for each stage using the ANOVA and Tukey HSD test adjusted to 95% significant level. Different letters indicate significant differences within the WT line in the different ripening stages, using the ANOVA and Tukey HSD test adjusted to 95% significant level.


