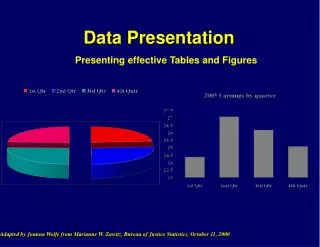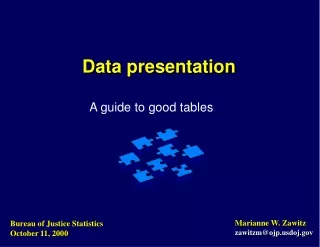

Data presentation
E N D
Presentation Transcript
IB ADVICE: It is strongly recommended that maps are student generated, either by being hand drawn or computer‑derived, and they must be made relevant to the study. Maps that are downloaded or photocopied should be adapted to the student’s own information and this may be achieved effectively by overlays. Normal map conventions must be followed.
ARCgissoftward login: BISHhumanities Password: humanities1 https://bishouston.maps.arcgis.com/home/organization.html
Statistical tests for geography • CORRELATION: to test for association/correlation/independence between 2 sets of data, formulate the Null Hypothesis and then: • If the data is at the ordinal or interval level AND BOTH SETS are normally distributed: use the Pearson Product-Moment Correlation Coefficient AND use a Linear Regression analysis IF you wish to predict values by constructing a line of best fit • If the data is at the ordinal or interval level and you're not sure if both sets of data are normally distributed: use the Spearman's Rank Correlation Coefficient https://sites.google.com/site/geographyfais/fieldwork/6-data-analysis/statistical-tools