Download
1 / 45
450 likes | 574 Views
Monitoring Climate Change from Space. Richard Allan Department of Meteorology, University of Reading. Why Monitor Earth’s Climate from Space?. Global Spectrum Current Detection Understanding Prediction. The problem. IPCC: www.ipcc.ch/ipccreports/ar4-wg1.htm.

E N D
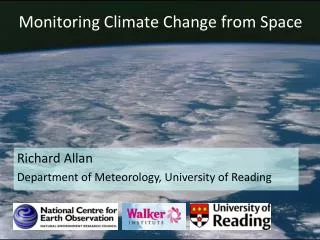
Monitoring Climate Change from Space Richard Allan Department of Meteorology, University of Reading
Why Monitor Earth’s Climate from Space? • Global • Spectrum • Current • Detection • Understanding • Prediction
The problem... IPCC: www.ipcc.ch/ipccreports/ar4-wg1.htm
Earth’s Radiation balance in space 4πr2 Thermal/Infra-red or Outgoing Longwave Radiation (OLR)=σTe4 πr2 S Absorbed Solar or Shortwave Radiation (S/4)(1-α) • There is a balance between the absorbed sunlight and the thermal/longwave cooling of the planet: (S/4)(1-α) ≈ σTe4 • How does it balance? Why is the Earth’s average temperature about 15oC? e.g. Lacis et al. (2010) Science
Earth’s global annual average energy balance Solar Thermal 240 Wm-2 240 Wm-2 Efficiency ~61.5% 390 Wm-2 Surface Temperature = +15oC Radiating Efficiency, or the inverse of the Greenhouse Effect, is strongly determined by water vapour absorption across the electromagnetic spectrum
Now double CO2 or reduce suns output: a “radiative forcing” Solar Thermal: less cooling to space 240 Wm-2 236 Wm-2 Efficiency ~60.5% 390 Wm-2 Surface Temperature = +15oC Radiative cooling to space through longwave emission drops by about 4 Wm-2 resulting in a radiative imbalance
The climate system responds by warming Solar > Thermal 240 Wm-2 236 Wm-2 Efficiency ~60.5% Heating 390 Wm-2 Surface Temperature = +15oC
The climate system responds by warming Solar = Thermal 240 Wm-2 240 Wm-2 Efficiency ~60.5% 397 Wm-2 Surface Temperature = +16oC The 2xCO2 increased temperature by about 1oC in this simple example. So what’s to worry about?
But it’s not that simple… IPCC (2007)
Clouds affect radiation fluxes • Radiation fluxes affect clouds
Feedback loops or “vicious circles” amplify or diminish initial heating or cooling tendenciese.g. Ice “albedo” Feedback Melting ice and snow CO2 Temperature Reduced reflection of suns rays Additional surface heating
One of the strongest positive amplifying feedbacks involves gaseous water vapour CO2 Water vapour Temperature Greenhouse effect Net Heating
Cloud Feedback: a complex problem • Clouds cool the present climate • Will clouds amplify or reduce future warming?
file:///C:/Documents%20and%20Settings/Richard%20Allan/My%20Documents/CONTED/ANIMATIONS/200603_60min_DUST.movfile:///C:/Documents%20and%20Settings/Richard%20Allan/My%20Documents/CONTED/ANIMATIONS/200603_60min_DUST.mov
Satellite measurements (1970, 1997) confirm the effect of increasing greenhouse gases IRIS/IMG spectra: Harries et al. 2001, Nature CH4 Stronger greenhouse effect CO2 O3 1/wavelength
Monitoring Natural forcings: The Sun ACRIM/VIRGO IPCC WG1 2.7.1 (p.188-193) 0.2 Implied changes in global temperature 0.1 0.0 Lean (2000) Y.Wang (2005) See also: http://www.pmodwrc.ch/pmod.php?topic=tsi/composite/SolarConstant
Monitoring Sea level IPCC 2007 Fig. 5.13 (p. 410) Satellite altimetry Recontructed (proxy) Coastal tide gauges
Current rises in global sea level Is sea level rising faster than projections made by numerical climate simulations? Research by Rahmstorf et al. (2007) Science, 4 May
Monitoring Land Ice From Space Above: results from Gravity Recovery And Climate Experiment (GRACE) mission Right: NASA's ICE-Sat satellite - Ice, Cloud and land Elevation Satellite
Arctic sea ice:recovery from 2007 minimum but robust downward trends in extent since 1979 measured by SSM/I satellite instruments NSIDC : http://nsidc.org/news
Remote sensing clouds and aerosol from space: Cloudsat and CALIPSO • Radar: ~D6, detects large particles (e.g. ice) • Lidar: ~D2, more sensitive to thin cirrus, low-level liquid clouds and aerosol pollutants but signal is attenuated Cloudsat radar CALIPSO lidar Insects Aerosol Rain Supercooled liquid cloud Warm liquid cloud Ice and supercooled liquid Ice Clear No ice/rain but possibly liquid Ground Target classification Work by Dr. Julien Delanoë and Prof. Robin Hogan, University of Reading
How will the water cycle change? Work by Dr. Ed Hawkins and Prof. Rowan Sutton, University of Reading
Trenberth et al., work published in the Bulletin of the American Meteorological Society (2009) and Intergovernmental Panel on Climate Change (2007)
Physical basis: water vapour • Physics: Clausius-Clapeyron • Low-level water vapour concentrations increase with atmospheric warming at about 7%/K • Wentz and Shabel (2000) Nature; Raval and Ramanathan (1989) Nature
Large-scale rainfall events fuelled by moisture convergence e.g. Trenberth et al. (2003) BAMS Intensification of rainfall (~7%/K?) Extreme Precipitation
Global Precipitation is constrained by energy balance Precipitation ~2-3%/K Water vapour ~7%/K Allen and Ingram (2002) Nature
Changing character of rainfall events Heavy rain follows moisture (~7%/K) Mean Precipitation linked to radiation balance (~3%/K) Precipitation Light Precipitation (-?%/K) Temperature See discussion in Trenberth et al. (2003) Bulletin of the American Meteorological Society
Climate model projections (see IPCC 2007) Precipitation Intensity • Increased Precipitation • More Intense Rainfall • More droughts • Wet regions get wetter, dry regions get drier? • Regional projections?? Dry Days Precipitation Change (%)
Using microwave measurements from satellite to monitor the water cycle Precip. (%) Allan and Soden (2008) Science
The rich get richer… Wet Precipitation change (%) Observations Dry Models Allan et al. (2010) Environmental Research Letters
Conclusions • Earth’s radiative energy balance drives climate change • It also provides a rich spectrum of information • Monitoring and detecting climate change • Understanding physical processes • Enabling and evaluating prediction • Challenges... • Clouds & Aerosol • Precipitation • Regional impacts
Earth’s global average energy balance:no atmosphere Solar Thermal 240 Wm-2 240 Wm-2 Efficiency = 100% 240 Wm-2 Surface Temperature = -18oC
Earth’s global average energy balance:add atmosphere Solar > Thermal 240 Wm-2 Heating 240 Wm-2 Temperatures rise
Earth’s global average energy balance:present day Solar Thermal 240 Wm-2 240 Wm-2 Efficiency ~60% 390 Wm-2 Surface Temperature = +15oC The greenhouse effect helps to explain why our planet isn’t frozen. How does it work?