Download
1 / 37
370 likes | 554 Views
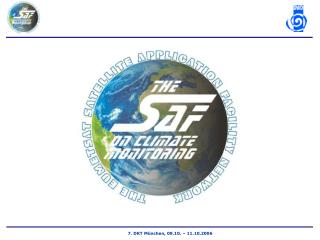
SAF on Climate Monitoring: Visions. Operational Climate Monitoring from Space The Satellite Application Facility on Climate Monitoring (CM-SAF) presented by Jörg Schulz, Deutscher Wetterdienst contributions from: Peter Albert, Steven Dewitte, Annegret Gratzki, Rainer Hollmann,

E N D
SAF on Climate Monitoring: Visions Operational Climate Monitoring from Space The Satellite Application Facility on Climate Monitoring (CM-SAF) presented by Jörg Schulz, Deutscher Wetterdienst contributions from: Peter Albert, Steven Dewitte, Annegret Gratzki, Rainer Hollmann, Karl-Göran Karlsson, Terhikki Manninen, Richard Müller, Rob Roebeling, and Werner Thomas
Outline 1. Network of Satellite Application Facilities and the CM-SAF 2. Meteosat Second Generation and MetOp 3. Products and Validation 4. Product Usage within Climate Sciences 5. Future Prospects
Why a dedicated CM-SAF? • The focus on climate aspects requires: • a long term commitment to ascertain (EUMETSAT) and process • (CM-SAF) data in an • operational and reliable environment / mode • Data processing and product generation with focus on climate aspects means: • generate homogeneous data sets (space and time) • carefully apply specific verification and validation procedures • in order to achieve: • quality controlled and • quality assured products with • appropriate condensation in space and time
Product Groups CM-SAF has the mandate to generate thematic climate data records in an operational off-line environment. It requires calibrated and cross calibrated radiance data sets from different satellite operators. The products come in three major groups: Cloud parameters (Cloud Fractional Cover, Cloud Top Height, Cloud Type, Cloud Top Temperature, Cloud Phase, Cloud Optical Thickness, Cloud Water Path) Radiation budget parameters at the surface and TOA (Surface: Incoming Short Wave Radiation, Net Short Wave Radiation, Outgoing Long Wave Radiation, Downward Long Wave Radiation, Net Long Wave Radiation, Radiation Budget, Albedo (weekly); TOA: Incoming solar radiative flux, Reflected solar radiative flux, Emitted thermal radiative flux) Water vapour in the atmosphere (Total and layered precipitable water, temperature, and relative humidity)
CM- SAF: Schedule & Versioning Initial Operations Phase V3 MSG + EPS Area Extension Merging All products V2 NOAA MSG HCP V1 NOAA Clouds Radiation I 2004 I 2005 I 2006 I 2007
Meteosat Second Generation MetOp as part of the Initial Joint Polar System
Meteosat-8 (first of Meteosat Second Generation) - Operational since 29 January 2004 - 12 spectral channels - Full disk imagery every 15 minutes - Meteosat-9: launch in 2nd quarter of 2005 - Two more satellites to follow <== for details see paper in BAMS, 2002 Courtesy of Jo Schmetz
Eight channels in thermal infrared spectrum Chl 8: 9.7 µm Chl 10: 12.0 µm Chl 6: 7.3 µm Chl 4: 3.9 µm Chl 11: 13. µm Chl 7: 8.7 µm Chl 5: 6.2 µm Chl 9: 10.8 µm Courtesy of Jo Schmetz
Calibration validation for thermal IR channels 2.50 Comparison to HIRS measurements 2.00 1.50 1.5 K 1.00 0.9 K 0.50 0.4 K 0.3 K Kelvin 0.2 K 0.00 IR 3.9 IR 6.2 IR 7.3 IR 9.7 IR 10.8 IR 12.0 IR 13.4 -0.3 K -0.50 -0.7 K -1.00 -1.50 -2.00 Courtesy of Jo Schmetz
MSG-1 GERB first image - 12 December 2002 Total channel Short wavelength channel
feb04 mar04 apr04 may04 Examples - Cloud Fractional Cover
Examples - CFC partially cloudy pixels feb04 mar04 apr04 may04
Comparison and resulting problems • Main results: • higher cloudiness over water surfaces • satellite results systematically lower than corresponding results from synop. stations - even lower over land(Possible) reasons: • (much) higher contrast over water • scenery effect () ? • observation rules ? • threshold algorithms exhausted ?Way out: • (more) physical retrieval ? • further tuning ? • new methods using temporal evolution ? European Cloud Climatology Courtesy of R. Meerkötter, DLR
Examples - CTY - May 6th, 2004 12:45 00:45 06:45 18:45
Instantaneous average CLWP Meteosat-8 (10:00 utc) = 15 gm-2 Noaa-17 (10:08 utc) = 22 gm-2 Daily CLWP Meteosat-8 Average = 73 g.m-2 Std = 78 g.m-2 MSG NOAA Cloud Optical Thickness& Cloud Liquid Water Path Cloud Properties for Cabauw, The Netherlands, 19 April 2004
Examples - Reflected & Emitted TOA flux Reflected solar flux March 04 Emitted thermal flux March 04
Monthly mean diurnal cycle Top of atmosphere emitted flux March 2004
Examples - Surface Albedo July04
Mar 04 Feb 04 Apr 04 May 04 Examples - Surface Downward Flux
HCP processing chain (V3) High resolution products TPW 3 layer PW Create Daily average 3 km2 sinusoidal projection Q/A SEVIRI Q/A Temporal sampling correction MERGER II superimpose merged vertical structure and TPW onto SEVIRI spatial sampling AMSU/B MHS SSM/I SSMIS TPW 5 layer PW, T Q/A Q/A MERGER I Optimum interpolation of daily fields on 45 km grid TPW n layer PW n level T, q Create Daily TPW, LPW, RH for each source in x km2 sinusoidal projection Q/A GRAS Q/A ATOVS IASI AIRS TPW 5 layer PW, RH, T 6 level T,q Q/A Q/A Merged products
Cloud Fraction (15 (km)2) ATOVS, June 8, 2004 TPW LPW @ 850 hPa - 700 hPa Rel. Humidity @ 850 hPa - 700 hPa Temperature @ 850 hPa - 700 hPa
Product validation data sources Operational meteorological networks of the NMHSs Special networks as e.g. BSRN, EUREF, GUAN Research sites as e.g. Cabauw, Sodankylä, Lindenberg, Valencia Measurement campaigns (Sodankylä April 2004, BBC,BBC2, CNN I & II, Vapic, Lautlos, AMMA)
Vertical albedo profiles 0 – 1000 m above various land use classes • Surface albedo of three about 10 km * 10 km areas scanned with 1 km spacing with a flight altitude of 450 m and a flight speed of 50 km/h • Calibration using albedo measurements at Sodankylä mast boreal forest aapa mire
Product validation - examples K.-G. Karlsson, SMHI R.Roebeling, KNMI T. Manninnen, FMI R. Hollmann, R. Müller, A. Gratzki, DWD
Q/A Data sets for water vapor validation • Level 1 radiances: • Use NWP monitoring systems, e.g. ECMWF data reception statistic; • Level 2 instantaneous and level 3 products: • ground based networks and reference sites via co-location, e.g., GPS, PMW, and radiosonde; • field campaign data, e.g., BBC2 at Cabauw, VAPIC at SIRTA site in Palaiseau, France, 2004, AMMA (West Africa); • other satellite data or algorithms, e.g, MODIS data or other SEVIRI algorithm; • cross comparison to models.
Seasonal 2-D distribution of cloudiness for the entire SCANDIA area (Scandinavia) in the period 1991-2000 SCANDIA RCA2 ERA-40 WINTER SPRING SUMMER AUTUMN SCANDIA: AVHRR-based cloud climatology (Karlsson, 2002, Int. J. Climatol., 23, 1023-1044) RCA2: SMHI Rossby Centre regional climate simulation model version 2(Jones et al, 2004, Ambio, 33, 199-220) ERA-40: ECMWF Re-Analysis cloud dataset (Uppala, 2001, ECMWF Workshop Proc.)
New RCA3 results investigating the effect of optically very thin clouds WINTER SPRING SUMMER AUTUMN SCANDIA RCA3 original RCA3 filtered Purpose for filtering: SCANDIA cloud detection limit close to optical thickness of 1.0 Conclusion: New RCA3 version shows an unrealistic seasonal cycle with too large contribution from optically very thin clouds!
New RCA3 results investigating the effect of cloud overlap assumptions WINTER SPRING SUMMER AUTUMN SCANDIA RCA3 Max-Random RCA3 Maximum Purpose: Modelled cloudiness sensitive to way of combining clouds in different vertical grid layers. Conclusion: Maximum overlap gives less cloudiness (as expected).However, different overlap assumptions cannot explain basic problem with seasonal cycle!
Key issues for the CM-SAF development • Some CM-SAF products will be global others not; • Extension of the time series backwards; • CM-SAF will have full re-processing capability; • Existing products will be improved, mostly by providing error estimates; • New parameters will be added, likely candidates are aerosols and precipitation; • CM-SAF is looking for international partnership with international bodies, satellite operators, and science institutions to be part of a global integrated climate monitoring network.
www.cmsaf.dwd.de Updated CM-SAF internet pages October 04 Data search and ordering through Web User Interface ( ~ Jan 05)