Download
1 / 32
320 likes | 507 Views
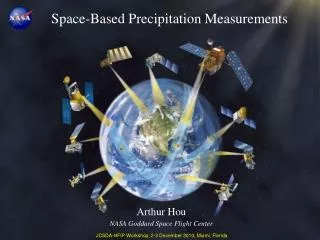
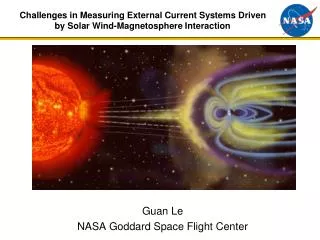
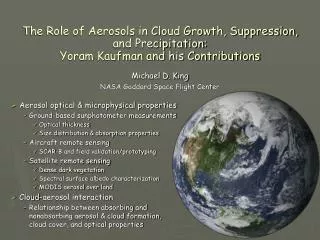
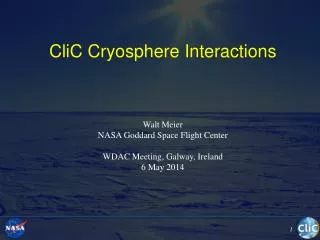
Monitoring polar climate change from space Thorsten Markus NASA Goddard Space Flight Center Greenbelt, MD 20771. February 1996 September 1996. February 1996 September 1996. Space-borne Capabilities:

E N D
Monitoring polar climate change from space Thorsten Markus NASA Goddard Space Flight Center Greenbelt, MD 20771
February 1996 September 1996
February 1996 September 1996
Space-borne Capabilities: • Visible (Passive: Photography; Active: Laser backscattering) • Thermal infrared (Passive: Temperature) • Microwave (Passive: Emission; Active: Radar backscattering)
Space-borne Capabilities: • Visible (Passive: Photography; Active: Laser backscattering • Very high spatial resolution (up to 15 m (Landsat)) • No measurements during night or under cloudy conditions • Thermal infrared (Passive: Temperature) • Very high spatial resolution • No measurements under cloudy conditions • Microwave (Passive: Emission; Active: Radar backscattering) • Passive: Coarse spatial resolution (6.25 - 50 km) • Active: High spatial resolution (30 m SAR) • No dependence on solar illumination • Penetration through clouds (“more or less”) • Passive: Daily to twice-daily global coverage • Capability to retrieve sub-surface information
Space-borne Capabilities: • Visible (Passive: Photography; Active: Laser backscattering • Very high spatial resolution (up to 15 m (Landsat)) • No measurements during night or under cloudy conditions • Thermal infrared (Passive: Temperature) • Very high spatial resolution • No measurements under cloudy conditions • Microwave (Passive: Emission; Active: Radar backscattering) • Passive: Coarse spatial resolution (6.25 - 50 km) • Active: High spatial resolution (30 m SAR) • No dependence on solar illumination • Penetration through clouds (“more or less”) • Passive: Daily to twice-daily global coverage • Capability to retrieve sub-surface information` The length of microwave observations and their continuous coverage make them the primary data source for climate studies of sea ice
Some microwave fundamentals: Every body (and everybody) is emitting radiation at a frequency spectrum depending on its temperature (blackbody radiation) - Sun (T = 6000 K): peak in visible range - Earth (T=280 K): peak in infrared range Microwave range is in far end of the spectrum Most objects are not perfect emitters (blackbodies) Emissivity (between 0 and 1)
For example: Sea ice These differences in emissivity enable us to derive sea ice concentration, i.e. the sea ice cover fraction within a pixel
Snow depth on sea ice • Idea: • Radiation from the ground is scattered by the snow cover. • The more snow the more scattering. • Scattering efficiency is frequency dependent. • hs = c (T37GHz-T19GHz) • Difficulties: • Different terrain forms • Scattering varies with snow physical properties (e.g., grain size, density, wetness) (From C.L. Parkinson, Earth from above,1997)
New mulityear ice mask for AMSR-E snow depth Snow depth product 10/2004 - 9/2005 Land Open ocean Multiyear ice Melt/freeze, Wx Summer melt
Other variables derivable from passive microwave data: • Sea ice type • Ice temperature • Melt onset and end • Sea ice drift
What is missing? The 3rd dimension! ICESat (laser altimeter) Cryosat2 (radar altimeter, 2009) hs s hf hi i w hs = snow depth hi = ice thickness hf = freeboard
Importance of sea ice (1): Global energy balance; Ice/snow albedo feedback Ocean Snow/ice Forest
Importance of sea ice (2): Ocean circulation What makes the ocean move? 1) Wind-driven surface currents 2) Thermohaline circulation
Change in temperature 30 years after collapse of the thermohaline circulation Michael Vellinga, Hadley Centre
Processes: Precipitation Ice drift Moisture flux Albedo From Gordon and Comiso, 1988
Antarctic sea ice increase with global warming? Warmer temperatures More moisture More precipitation More freshwater input into ocean More stable Southern Ocean Less entrainment of WDW More sea ice production
Antarctic sea ice increase with global warming? Warmer temperatures More moisture More precipitation More freshwater input into ocean More stable Southern Ocean Less entrainment of WDW Thicker snow on sea ice More thermal insulation More snow- to-ice conversion More sea ice production Less basal freezing
Change in sea ice volume as a function of precipitation (Balance between thermal insulation and snow-to-ice conversion)
Past Present Future Observations Assimilation Extrapolation; trends; cycles Data analysis; process studies Validation; enhancement Modeling