Download
1 / 28
290 likes | 447 Views
Leonid Yurganov, Senior Research Scientist University of Maryland Baltimore County. Greenhouse effect, climate changes, and monitoring of the greenhouse gases from space. Who am I? I am a Russian, working in US.

E N D
Leonid Yurganov, Senior Research Scientist University of Maryland Baltimore County Greenhouse effect, climate changes, and monitoring of the greenhouse gases from space.
Who am I? I am a Russian, working in US. I was graduated as MS at the Physics Department of the Leningrad University in 1969 (atmospheric optics), defended my thesis in 1979 at the Obukhov Institute of Atmospheric Physics (IAP) (atmospheric IR spectroscopy). I used to work both at IAP and AARI, I have been 4 times (seasons) to Antarctica and 3 times to the Arctic (Severnaya Zemlya and Wrangel Isl.). This is my second time at the Akademik Fedorov. In 1995 I moved to Alaska, UAF, GI, between 2007 and 2001 I worked for University of Toronto (Canada), between 2001 and 2006, in Japan, Yokohama, and since 2006 I have been in Baltimore. My major is analysis of global atmospheric composition using satellite data. I've been studying CO for a long time, now methane is my goal. Also I am dealing with SO2, NO2, and AOD.
I am going to present two talks at the school. Today I will be talking about the greenhouse effect, as a phenomenon laying down in the basics of the climate change problem. Also some problems of satellite retrievals of the atmospheric composition will be over- viewed The next talk will be about methane in more detail. We start with the greenhouse effect. As you know, the Earth is a planet in the Solar system.
Here are the planets of the Solar system The Earth as a planet. Jupiter Saturn Uranus Neptune Pluto Mercury Venus Earth Mars
The closer to the Sun, the higher temperature We can see that the Venus has a temperature of 400o C higher than it should be expected from its range to the Sun.
Venetian landscape Due to so high temperature the surface of the Venus is a lifeless desert.
The explanation is greenhouse effect! Atmospheric composition of the terrestrial planets This are compositions of atmospheres (Venus and Mars in relation to the Earth air column) in percent Earth Venus Mars N2 78 0.02 3 x 10⁻² O2 20 < 0.1 10-5 Ar 1 0.5 2 x 10 -2 CO2 0.04 8800 0.9 H2O ~ 2 ~ 1 ~10-4 Temperature oC +15 +450 - 60
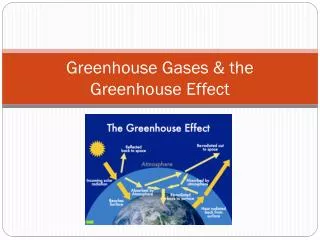
Why CO2 is so bad guy? The answer is in its absorptionspectrum. The Sun is very hot, its temperature is ~ 6000°K. It emits electromagnetic radiation in the visible spectral range. The atmosphere is transparent to visible light, the surface partly reflects this radiations back to space, partly absorbs it and warms up. CO2 plays a leading role in the greenhouse effect due to large amounts of this gas emitted at any combustion. Other gases influenced by the human activities are methane (CH4), nitrous oxide (N2O), tropospheric ozone (O3). UV Vis Near IR T h e r m a l I R
Greenhouse gases Without an atmosphere (a case of “naked” Earth ) the temperature of the Earth would be –18o C. The greenhouse effect warms it up to +15o C. So, it is a very useful effect! However, growing concentrations of some greenhouse gases may be a problem. Greenhouse gases: Gas No. 1 is water vapor (H2O), it responds for the most of the “natural” warming. Gas No. 2 is carbon dioxide (CO2), it is emitted during any combustion. Fossil fuels (oil, gas, coal) and wood are converted into CO2 when we burn them. Gas No. 3 is methane (CH4), it is emitted by all the animals, by swamps, by coal mines and is leaking from natural gas pipelines (ARCTIC OCEAN NEXT TIME) . Gas No. 4 is nitrous oxide (N2O), so called “laughing” gas, used in anesthesia. It is emitted by fertilized agricultural fields, esp. rice fields. • Several other gases with less contributions and aerosol, which may have warming and cooling effects.
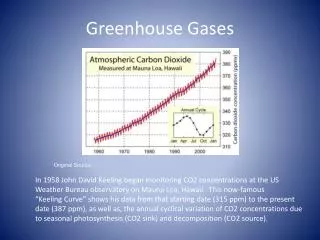
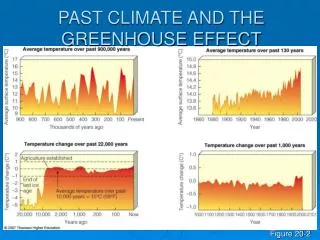
The changing concentrations of greenhouse gases.(ppb stands for parts per billion, ppm stands for parts per million) They have been constant for at least 600 years and started to grow since the beginning of the industrial revolution
Feedback loops Modeling of climate is very complicated because of feedbacks. They may be positive and negative. I will give you two examples. Negative feed back. 1. Temperature increases due to growing absorption by CO2. 2. The water on the ground evaporates, going into the atmosphere and clouds appear. 3. Clouds attenuate solar radiation and the temperature drops. This is a negative feed back loop! Temperature CO2 Temperature Evaporation
Positive feed back. Polar ice. Temperature 1. Temperature increases due to growing absorption by CO2 and CH4. 2. Polar ice melts and Solar radiation is absorbed by dark water surface Temperature 3. Temperature further increases. 4. The sea ice completely disappears. CO2 5. Polar bears are dying. There are dozens of feedback loops in the climatic system. This makes global modeling not very certain.
Satellites to monitor greenhouse gases Satellite-borne instruments have been on orbit since 2002. Methane, CO2 concentrations can be retrieved from their NIR and TIR spectra.
Satellites using Solar and thermal IR radiation Thermal (or terrestrial) radiance has a maximum near λ~10 μm (ν=1/λ=1000 cm-1) Solar radiance has a maximum near λ~ 0.5 μm (500 nm), and it is attenuated by scattering, clouds, aerosol, etc T ~ 6000 K Sat Sat T ~ 260-300 K T ~ 260-300 K
SATELLITES FOR METHANE . Near IR, 1.8 μm, (e. g., SCIAMACHY) sensors have problems in the Arctic: low sun, low reflectivity for ice, snow, and water: low S/N. Thermal IR instruments (~7.8 μm) on polar orbits (AIRS, IASI, TANSO): lots of data day and night, but low sensitivity near the surface.
Thermal IR (TIR) averaging kernels tropics Mid-latitudes Arctic AK for IASI methane Grd – 3 km Razavi et al., ACP, 2010
Methane sources Most of methane is the result of recent microbial activities (wetlands, both natural and rice paddy fields), as well as ruminants and landfills. Natural gas leaks, seepage, and coal mines are examples of “ancient” methane. Present estimates of methane from gas hydrates and from oceans are small, just a few percent. Total source is ~ 500 Tg (Mt) CH4 per year
Global/hemispheric (no Arctic): satellite vs in-situ data ESRL flask network ESRL vs AIRS and SCIAMACHY ESRL – surface network (just a few sites in the Arctic, and only on shore (GLOBALVIEW-CH4) SCIAMACHY – Near IR (~ 1.8 μm), tropospheric depth (courtesy Christian Franckenberg, JPL), very few data in the Arctic/Antarctic AIRS – TIR (~ 7.8 μm), upper troposphere, including Arctic
Anomalies (seasonal cycles subtracted), red – Southern hemisphere , blue – Northern hemisphere SCIAMACHY, no Arctic AIRS, 360 hPa Sampling network ESRL/NOAA SCIAMACHY: courtesy Ch. Franckenberg (JPL), ESRL – GLOBALVIEW_CH4-2009
Next time I will give you more information about methane in the Arctic, observed by TIR satellites as well as about what we are measuring in this cruise.