Download
1 / 13
130 likes | 247 Views
Warm Season Thunderstorm Patterns Over the New Jersey Area. Al Cope Paul Croft National Weather Service Kean University Mount Holly, NJ Union, NJ. Purpose/Intent. Partnering. Determine Convective Initiation

E N D
Warm Season Thunderstorm Patterns Over the New Jersey Area Al Cope Paul Croft National Weather Service Kean University Mount Holly, NJ Union, NJ
Purpose/Intent Partnering • Determine Convective Initiation • Identify Patterns & Coverage • Movement, Intensity, Duration Thunderstorm Characteristics: • Spatial – Linear, Isolated, Clustered, Scattered, Widespread & where will they occur? • Temporal– When will they occur? Continuous in time? How long will they last? • Severity – Pulse, Squall, Organized & type of severe weather or hazard (i.e. tornado, high wind, large hail, heavy rain, lightning) Mount Holly Improved Warning/Operational Support
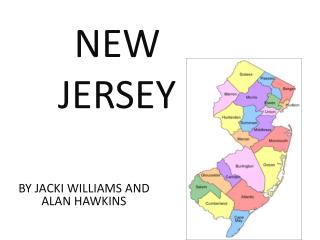
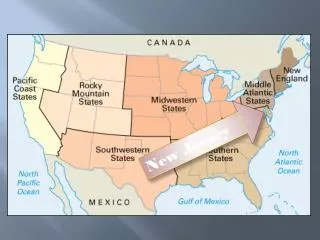
Topography and Land Use Topography
Summer data collection at Kean U. and NWS Mount Holly, NJ (Kean students and student volunteers at NWS PHI) Daily data collection and archive of radar every three hours (more when warranted) – mapping of cells/features as well as time and motion Maps: Upper Air, Surface Analyses Numeric Values: Skew-T, Satellite-derived, others Other Features: Sea breeze, mountain-valley circulations, physiographic features WRF Modeling (http://hurri.kean.edu/~nwpmodel) – in-house mesoscale model (see expected evolution from dynamic model perspective) “Event” activity initiates after 12 UTC “Contaminate” activity is ongoing and/or moving into region before 15 UTC “Non-Event” is null case, no activity observed between 12 and 00 UTC Data Collection – 2006 & 2007
Methods & Products • Initiate Analysis for determination of spatial and temporal distributional characteristics and behaviors of convective initiates and the subsequent and total activity across the study area • Statistical Analysis for determination of convective features and to assess relationship to synoptic weather patterns, mesoscale circulations, and physiographic features
Contaminates – 500mb W & SW Flow West Flow at 500 mb Southwest Flow at 500 mb
Initial Results… Convective Events • Initiates (W) similar location of origin to contaminates but they mostly developed outside NJ; most total activity isolated clusters or cells & less “focused” in comparison to contaminates • June progressing to August shows just over half initiates have origin in southern half of study region versus very little in those locations during the early summer • Initiates (SW) were found across study region and were not constrained to southern NJ (as were the contaminates) • Activity highly variable, but limited, in time-placement-coverage versus contaminates that tended to cluster Convective Contaminates • Contaminates do not preclude further activity with only one exception • Contaminates more ‘focused’ cell areas with W-500mb flow • S/SW flow contaminates mostly found in southern NJ & coastal regions • Seasonal progression appears to reduce the “source region” of initiation in NE PA and NW NJ • Total activity highly variable
Initiates for Events • Most initiates in NE-PA/NW-NJ • Trend toward S-NJ later in Summer Role of Topography?
Sea-breeze Influences • Favored in July and August • 500mb flow from W and SW • Often weak/short-lived (not always) • Generally occurred well inland
Collect and analyze data from previous years Look at severity, lightning, flooding, etc. based on different regimes Investigate role of sea breeze, topography, other meso-scale factors…relate to large-scale Verify NWS grid/tabular forecasts vs. observed T-storm activity (Pop, QPF, Weather, Sky…) Develop conceptual models and and forecast guidelines for initial activity and evolution Continuing Work…
Fin…Ende…Finis…The End Questions??? Acknowledgements Kean Department of Geology & Meteorology Faculty & Staff, Students and Majors, Alumni NWS Mount Holly Staff and Student Volunteers Kean University Meteorology Program Office of Research & Sponsored Programs Center for Professional Development This report was prepared by Kean University and the National Weather Service under a sub-award with the University Corporation for Atmospheric Research (UCAR) under Cooperative Agreement with the National Oceanic and Atmospheric Administration (NOAA), U.S. Department of Commerce (DOC).