Download
1 / 18
180 likes | 211 Views
CHEMISTRY-CLIMATE INTERACTIONS: science questions, science needs Daniel J. Jacob. THE BROAD QUESTIONS: How do chemical processes in the troposphere affect climate change? How does climate change affect air quality?. Focus on three chemical themes:

E N D
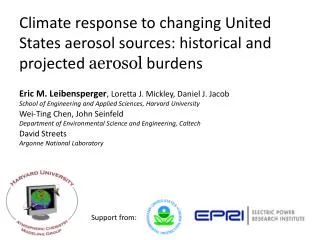
CHEMISTRY-CLIMATE INTERACTIONS:science questions, science needsDaniel J. Jacob THE BROAD QUESTIONS: • How do chemical processes in the troposphere affect climate change? • How does climate change affect air quality? Focus on three chemical themes: (1) organic aerosols, (2) radicals, (3) tropospheric ozone
SECONDARY ORGANIC AEROSOL (SOA):underestimated component of climate forcing? simulated/observed ratios from recent measurement campaigns Volkamer et al. [2006] Current model parameterizations based on gas-aerosol thermodynamic partitioning of semi-volatile products of VOC oxidation grossly underestimate OC aerosol concentrations in aged air
SOx WSOC (R. Weber) Model OC attribution Observations GEOS-Chem Total Fires Fossil fuel Biogenic WSOC AEROSOL OVER EASTERN U.S. IN ITCT-2K4 • Observed free tropospheric concentrations are lower than in ACE-Asia; • model is only 25% too low in the mean… • …but is incapable of reproducing observed variability in boundary layer (r2 = 0.11) or free troposphere (r2 = 0.05) • Observed free tropospheric WSOC has significant correlation (r2 ~ 0.3) with methanol combined with sulfate, nitrate, or toluene; suggests cloud production mechanism and combined bio-anthro source Heald et al. [2006]
EFFECT OF 2000-2050 GLOBAL CHANGE ON ANNUAL MEAN ORGANIC CARBON (OC) AEROSOL CONCENTRATIONS (mg m-3) Climate change effect is mainly through biogenic SOA and is small because of compensating factors (higher biogenic VOCs, higher volatility) 2000 conditions: OC, mg m-3D(2000 emissions & 2050 climate) Wu et al. [2007]
WILDFIRES: A GROWING OC AEROSOL SOURCE Total carbonaceous (TC) aerosol averaged over all contiguous U.S. IMPROVE sites S. California fire plumes, Oct. 25 2004 Secondary formation? ~100 IMPROVE sites nationwide • Interannual variability in organic aerosol is largely determined by wildfires • Open fires contribute about 25% of annual mean PM2.5 in the western U.S., 10% in the east • Dominant contributions from western U.S. fires (in the west), Canadian fires (in the northeast), prescribed fires (in the southeast) • U.S. fire source expected to increase over the next decades Park et al. [2007]
HOW DO WE PROGRESS ON ORGANIC AEROSOL? • Improve OC aerosol characterization • Intercomparison of different methods aboard aircraft for range of conditions; test measurements of mass concentrations, chemical speciation • Characterize mixing state, hygroscopicity, optical properties • Validate/interpret satellite AOD observations in high-OC regions • Better understand relationship to precursors • Continental boundary layer mapping for polluted vs. clean vegetated areas • Lagrangian sampling of pollution and fire plumes over ocean, in free troposphere. • Payload should include VOCs, (di)carbonyls, carboxylic acids that might be involved in SOA production
Hudman et al. [2007] HOx RADICALS: DRIVERS OF METHANE SINK AND OF AEROSOL AND OZONE FORMATION Simulated vs. observed concentrations during INTEX-A (summer 2004) (Brune, Heikes, Fried, Huey) Large and inconsistent differences between models and observations discourage analyses of factors controlling HOx concentrations
RADICAL BROMINE CHEMISTRY IN TROPOSPHERE GOME satellite instrument observes 0.5-2pptv BrO in excess of what stratospheric models can explain. Large enhancement seen in polar spring; confined to boundary layer or larger extent? Tropospheric BrO from OMI March 11, 2005 (K.V. Chance) Tropospheric BrO ? due to Arctic BL spring bloom Important implications for tropospheric HOx, ozone, NOx, and mercury
0 0.6 1.2 1.8 2.4 3 0 0.6 1.2 1.8 2.4 3 0 0.6 1.2 1.8 2.4 3 Methanol, ppbv model atmospheric source THE MYSTERY OF OXYGENATED VOCs Methanol vertical profiles over South Pacific (PEM-Tropics B) GEOS-Chem observed (Singh) Jacob et al. [2005] Models cannot reproduce background observations of methanol, acetone (200 pptv), acetaldehyde (~100 pptv) in remote air…Could there be a missing “VOC soup” driving organic chemistry in the remote troposphere?
HOW DO WE PROGRESS ON TROPOSPHERIC RADICALS? • Improve and validate aircraft instrumentation • Intercompare different HOx measurement techniques; • Develop measurement capability for CH3O2 • Develop measurement capabilities for BrO and reservoir species • Interpret observed variability of HOx, BrO radical concentrations in relationship to reservoirs, NOx, other variables • Aircraft observations over wide range of conditions; • Begin with box models including max observational constraints, graduate to 3-D models accounting for transport of reservoirs
TROPOSPHERIC OZONE: 3rd ANTHROPOGENIC GREENHOUSE GAS Model values for preindustrial ozone yield radiative forcing DF = 0.4 W m-2 (IPCC) } Observations at European mountain sites [Marenco et al., 1994]: imply DF = 0.8 W m-2 [Mickley et al., 2001] Models fail to reproduce observed ozone trends over 20th century or over past decades; implies uncertainty in radiative forcing, hemispheric pollution
SATELLITE OZONE RETRIEVALS: WHO’S RIGHT? IR emission measurement from TES UV backscatter measurement from GOME GOME JJA 1997 tropospheric columns (Dobson Units) Zhang et al., 2006 Liu et al., 2006 GEOS-Chem model maximum over Middle East [Li et al., 2001]: is it real? Also long-standing model problem of overestimate vs. ondes over South Asia…
Observations GEOS-Chem model (standard) GEOS-Chem model (lightningx4) Observations and model simulations from ICARTT aircraft campaign over eastern N. America in summer 2004 MAJOR SOURCE OF NOx FROM MID-LATITUDES LIGHTNING Observed flash frequency implies 500 moles NOx per flash …suggests great sensitivity of ozone to climate change Hudman et al. [2007]
OMI HCHO TESTS ISOPRENE EMISSION INVENTORIES Isoprene emissions from the MEGAN biogenic emission inventory (summer 2006) HCHO columns from OMI satellite instrument (summer 2006) ? Individual VOC contributions to HCHO column (INTEX-A) • OMI indicates overestimate of broadleaf deciduous source in MEGAN; • no support for “isoprene volcano” in the Ozarks Millet et al. [2006, 2007]
USE OZONE-TEMPERATURE CORRELATION TO ESTIMATE EFFECT OF CLIMATE CHANGE ON AIR QUALITY Probability of max 8-h O3 > 84 ppbv vs. daily max. temperature Projected T change for northeast U.S. in 2000-2100 simulated with ensemble of GCMs for different scenarios [IPCC, 2007] Northeast Los Angeles Southeast Lin et al. [2001] Probability of exceedance doubles Probability DT = 3K Temperature, K By 2025, DT = 1-3 K depending on model and scenario; use statistical approach at right to infer increased probability of ozone exceedance for a given region or city assuming nothing else changes. Effect is large! Lin et al. [2007]
CHANGES IN SUMMER MEAN 8-h AVG. DAILY MAXMUM OZONE FROM 2000-2050 CLIMATE CHANGE GISS/GEOS-Chem model results 2000 conditions ( ppb) D (2000 emissions & 2050 climate) Isoprene emis +30% Δ(O3) • Increase in midwest and northeast • (up to 10 ppbv in pollution episodes) • No change in southeast where isoprene nitrates are an important sink for NOx; controversial! Wu et al. [2007]
HOW DO WE PROGRESS ON TROPOSPHERIC OZONE? • Validate and improve satellite observations • validate TES and OMI over tropical/subtropical continents • assimilate TES+OMI+other data including precursors for determination of inconsistencies • develop new passive instrumentation for UV+IR (+ Chappuis?), active instrumentation • Better define lightning NOx source using satellite and aircraft • need further development/validation of HNO3 satellite retrievals • Focus on tropics – leverage on new lighning detection networks • Better define isoprene source using satellite and aircraft • Focus on tropics – use aircraft to measure VOC emission fluxes and determine local relationship to HCHO (photochemistry) • Better understand factors controlling sources, chemistry of biogenic VOCs • Sensitivity to environmental conditions (satellites, towers) • Atmospheric chemistry of organic nitrates and peroxides (aricraft, towers) • Improve understanding of stratosphere-troposphere exchange • Satellite observations with high vertical resolution (HIRDLS or follow-on)
Clean air sweeps behind cold front GISS GCM 2’ simulations for 2050 vs. present-day climate using pollution tracers with constant emissions Mid-latitudes cyclones tracking across southern Canada are the main drivers of northern U.S. ventilation EFFECT OF CLIMATE CHANGE ON REGIONAL STAGNATION Sunday night’s weather map 2045-2052 Northeast U.S. CO pollution tracer summer 1995-2002 Pollution episodes double in duration in 2050 climate due to decreasing frequency of cyclones ventilating the eastern U.S; this decrease is an expected consequence of greenhouse warming. Mickley et al. [2004]