Download
1 / 29
290 likes | 305 Views
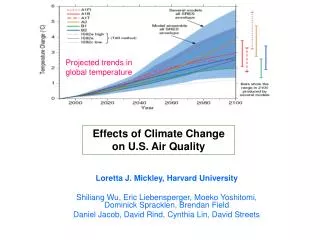
Explore the global budget of atmospheric acetone emissions, sources, sinks, and intercontinental transport patterns at northern midlatitudes using TRACE-A and other observations and simulations.

E N D
CONTINENTAL OUTFLOW AND INTERCONTINENTAL TRANSPORT AT NORTHERN MIDLATITUDES (and a few UT/LS topics) Daniel J. Jacob Atmospheric Chemistry Modeling Group Harvard University
TRACE-A ARE ATMOSPHERIC OBSERVATIONS OF ACETONECONSISTENT WITH CURRENT UNDERSTANDINGOF SOURCES AND SINKS? ABLE -3B Surface sites PEM -WB SONEX PEM-TB
GLOBAL BUDGET OF ATMOSPHERIC ACETONE Singh et al. Jacob et al. [2002] [2000] (a priori) (a posteriori) SOURCES (Tg yr-1) 56 (37-80) 78 (49-105) 95 (80-110) Terrestrial vegetation 15 (10-20) 26 (0-52) 33 (24-42) Plant decay 6 (4-8) 9 (0-18) 2 (-3-7) Biomass burning 5 (3-10) 3 (2-5) 5 (3-7) Industry 2 (1-3) 1 (1-2) 1 (1-2) Oceans 0 10 (0-20) 27 (21-33) Oxidation of isoalkanes 17 (12-24) 20 (10-30) 21 (16-26) Oxidation of terpenes, MBO 11 (7-15) 9 (3-15) 7 (3-11) SINKS (Tg yr-1) 56 (37-80) 78 95 Photolysis 36 (24-51) 44 46 Oxidation by OH 13 (9-19) 25 27 Deposition to land 7 (4-10) 9 9 Uptake by ocean 0 0 14 LIFETIME 16 days 20 days 15 days
OCEANIC SIGNATURE IN ATMOSPHERIC ACETONE OBSERVATIONS South Pacific [Singh et al., 2001] southern Norway [Solberg et al., 1996] Low winter values over Europe imply ocean sink High values over South Pacific imply large ocean source a priori sources/sinks; c2 = 1.3 a posteriori sources/sinks (including “microbial” ocean sink, photochemical ocean source); c2 = 0.39
SURFACE AIR ACETONE CONCENTRATIONSIN A POSTERIORI SIMULATION
METHYL IODIDE: TRACER OF MARINE CONVECTION IN GLOBAL ATMOSPHERIC MODELSLoss by photolysis (~4 days), relatively uniform ocean source, large aircraft data base [D.R. Blake, UCI] Observations Model (GEOS-CHEM) MCI: 0.40 (obs) 0.22 (mod) MCI: 0.16 (obs) 0.14 (mod) • Define Marine Convection Index (MCI) as ratio of upper tropospheric (8-12 km) • to lower tropospheric (0-2.5 km) CH3I concentrations • MCI over Pacific ranges from 0.11 (Easter Island dry season) to 0.40 (observations over tropical Pacific • GEOS-CHEM reproduces observed MCI with little global bias (+11%) but poor correlation (r2 = 0.15, n=11) Simple model for ocean source Bell et al. [2002]
SURFACE OZONE BACKGROUND IN THE U.S. IMPORTED FROM OUTSIDE IS A SIZABLE INCREMENT TOWARDS VIOLATION OF U.S. AIR QUALITY STANDARDS(even more so in Europe!) Europe (8-h avg.) Europe (seasonal) U.S. (8-h avg.) U.S. (1-h avg.) 0 20 40 60 80 100 120 ppbv preindustrial present background
OZONE BACKGROUND OVER U.S. IS GENERALLY DEPLETED DURING REGIONAL POLLUTION EPISODESdue to deposition and chemical loss under stagnant conditions Observed (J.W. Munger) model (GEOS-CHEM) model background O3 vs. (NOy-NOx) At Harvard Forest, Massachusetts Background (clean conditions) Background (pollution episodes) Fiore et al. [2002] Pollution coordinate
RANGE OF ASIAN/EUROPEAN POLLUTION SURFACE OZONE ENHANCEMENTS OVER THE U.S. IN SUMMERasdetermined from a simulation with these emissions shut off Subsidence of Asian pollution + local production Max Asian/European pollution enhancements (up to 14 ppbv) occur at intermediate ozone levels (50-70 ppbv) stagnation tropical air MAJOR CONCERN IF U.S. OZONE STANDARD WERE TO DECREASE! U.S. standard European standards Fiore et al. [2002]
NORTH AMERICAN OZONE OUTFLOW IN SURFACE AIR (GEOS-CHEM model results for 1997) APRIL L H L JULY H Li et al. [2002]
Observed [Simmonds] OZONE DATA AT MACE HEAD, IRELAND Model vs. observed stats, 1993-1997 Time series, Mar-Aug 1997 GEOS-CHEM model N.America pollution events in model Li et al. [2002]
FORECASTING TRANSATLANTIC TRANSPORT OF NORTH AMERICAN POLLUTION TO EUROPE WITH THENORTH ATLANTIC OSCILLATION (NAO) INDEX NAO index = normalized surface P anomaly between Iceland and Azores NAO Index North American ozone pollution enhancement At Mace Head, Ireland (GEOS-CHEM model) r = 0.57 Li et al. [2002] Greenhouse warming a NAO index shift a change in transatlantic transport of pollution
EFFECT OF NORTH AMERICAN SOURCESON VIOLATIONS OF EUROPEAN AIR QUALITY STANDARD (55 ppbv, 8-h average) GEOS-CHEM model results, summer 1997 Number of violation days (out of 92) # of violation days that would not have been in absence of N.American emissions Li et al. [2002]
Enhancements in Asian surface ozone due to European anthropogenic emissions (GEOS-CHEM, 1996) Liu et al. [2002]
GLOBAL MODEL ANALYSIS OF OZONESONDE OBSERVATIONS ALONG THE PACIFIC RIM (1993-1997) Hong Kong, 1996 High UT variability at Hong Kong in winter-spring reflects alternance of tropical and stratospheric influences 300-120 hPa observations GEOS-CHEM model 700-300 hPa Spring enhancement from SE Asian biomass burning 850-700 hPa Liu et al. [2002]
ALTERNANCE OF TROPICAL AND STRATOSPHERIC INFLUENCES IN WINTER UT OVER HONG KONG:comparison of Dec 24, 1996 and Jan 6, 1997 Observed GEOS-CHEM Sonde and model profiles Model ozone concentrations and fluxes, 200 hPa Stratospheric ozone tracer at longitude of Hong Kong Liu et al. [2002]
200 hPa ozone fluxes across Pacific Rim (GEOS-CHEM, 1996) • Tropical and midlatitude influences • Easterly circulation away from Pacific in summer Liu et al. [2002]
SUMMER UT OZONE POLLUTION EVENT OVER HONG KONGAugust 21, 1996 Asian pollution Sonde and model profiles Observed GEOS-CHEM Model enhancement of ozone concentrations and fluxes due to Asian anthropogenic sources Liu et al. [2002]
WHAT OBSERVATIONS AND MODELS ARE NEEDEDTO BETTER QUANTIFY INTERCONTINENTAL TRANSPORT? SATELLITE OBSERVATIONS Global and continuous but few species, low resolution Source/sink inventories 3-D CHEMICAL TRACER MODELS SURFACE OBSERVATIONS high resolution but spatially limited Assimilated meteorological data AIRCRAFT OBSERVATIONS High resolution, targeted flights provide critical snapshots for model testing Chemical and aerosol processes INTERCONTINENTAL TRANSPORT: CONCENTRATIONS AND FLUXES
Satellite data in near-real time: MOPITT TOMS SEAWIFS AVHRR LIS TRACE-P MISSION(Mar-Apr 2001) Stratospheric intrusions FLIGHT PLANNING Long-range transport from Europe, N. America, Africa 3D chemical model forecasts: - ECHAM - GEOS-CHEM - Iowa/Kyushu - Meso-NH -LaRC/U. Wisconsin ASIAN OUTFLOW Boundary layer chemical/aerosol processing DC-8 P-3 PACIFIC • Emissions • Fossil fuel • Biomass burning • Biosphere, dust ASIA PACIFIC
GOME daily data of NO2 and HCHO tropospheric columns during TRACE-P (3/15 - ) Randall Martin Thomas Kurosu/Kelly Chance Slant HCHO column, single orbit on 3/27 Mean slant NO2 column, 3/16-4/15
C2Cl4 CONCENTRATIONS MEASURED IN TRACE-P Symbol size ->1/altitude Don Blake, UCI
INVERSE ANALYSIS OF CO SET UP FOR TRACE-Pa priori Asian emissions appear low but not outrageously so Paul Palmer, Harvard
PRELIMINARY GLOBAL (GEOS-CHEM) 3-D MODEL ANALYSIS OF TRACE-P OBSERVATIONS Mat Evans, Harvard
GLOBAL MODEL ANALYSIS OF TRACE-P OBSERVATIONS: SENSITIVITY TO SOURCES OZONE CO Median model/observed Median model/observed Median model/observed Mat Evans, Harvard
INTERCONTINENTAL TRANSPORT EXPERIMENT – NORTH AMERICA (INTEX-NA) The next NASA Global Tropospheric Experiment (GTE) mission OBJECTIVES: • To quantify the North American import and export of (1) atmospheric oxidants and their precursors, (2) aerosols and their precursors, (3) long-lived greenhouse gases • To relate this import/export to surface sources/sinks and to continental boundary layer chemistry TWO AIRCRAFT:NASA DC-8 and P-3 • TWO PHASES: • Summer 2004: • active photochemistry, biosphere • aerosol radiative forcing • carbon uptake • Spring 2006: • maximum Asian inflow • contrast with summer
INTEX NOMINAL FLIGHT TRACKS FOR PHASE A (SUMMER) RL BG WL AZ DR BR NO HI DC-8 P-3B Ozonesonde sites
INTEX-NA HAS LINKAGES WITH A NUMBER OF ATMOSPHERIC PROGRAMS • In situ • North American Carbon Program (2002-) • NOAA Northeast U.S. Study (2004) • European UT/LS program (-2005) - LET’S TALK!!! • Asian APARE program (ongoing) • Satellites • Terra [MOPITT] (1999-) • Envisat [SCIAMACHY, MIPAS] (2002-) • NMP/GIFTS (2004-) • Aura [TES, OMI, HRDLS, TES] (2004-) • Modeling • EPA OAQPS/ORD climate change/air quality initiative (2001-2010)