Download
1 / 36
360 likes | 510 Views
Mammalian Cell Culture Sensors and Models. Trish Benton Michael Boudreau. Presenters. Trish Benton Michael Boudreau. 483? That means big trouble. Landscape. New at-line and inline sensors. Concentration Control. Modeling. Data Analytics. Sensors. At –line Nova, HPLC In-line

E N D
Mammalian Cell CultureSensors and Models Trish Benton Michael Boudreau
Presenters • Trish Benton • Michael Boudreau
483? That means big trouble
Landscape New at-line and inline sensors ConcentrationControl Modeling Data Analytics
Sensors • At –line • Nova, HPLC • In-line • Fogale, Aspectrics, Optek, CO2, differential pressure
On-line viable cell density • In and induced electrical field, an intact cell membranes is a physical barrier to ion migration. • Capacitance measured in picoFarads plotted against the frequency of change of an electrical field, measured in MHz, gives a beta-dispersion spectrum.
Fogale uses Entire Dielectric Spectrum • Older analyzers measured capacitance at only one frequency. • Newer analyzers use a non-linear least squares fit of random measurements to generate the whole spectrum. • Concentration range: 0 -109 cell/ml for animal cells0 - 200 g/l dry weight for yeast and bacteria • Resolution: 0.01 - 106 cell/ml for animal cells0.02 g/l dry weight for yeast
Automated Multifunction Analyzers • A robotic combination of enzymatic, amperometric, potentiometric and Coulter counter or CCD camera analyzers. • They can measure: • Sugar and amino acid substrates • Metabolic byproducts • Dissolved Oxygen and Dissolved Carbon Dioxide • pH • Cell Density and viability • Sodium, potassium, calcium, phosphate • “Gold Standard” freezing point test for osmolality.
Autosamplers • Autoclavable, multipoint auto-samplers enable multifunction analyzers to make at-line measurements. • Small sample size allow more frequent analysis. A 5L cell culture bioreactor can be sampled once every 4 hours.
Encoded Photometric Infrared Spectroscopy • Encoded Photometric infrared analyzers can detect the constituents of multiple frequencies simultaneously • EP IR analyzer is a non-dispersive measurement where the radiation beam is dispersed according to wavelength after it has passed through a sample • Chemometric analysis is off-line.
EP IR Measurement in Cell Culture • A single analysis function can measure: • Glucose • Glutamine • Glutamate • Proline • Lactic Acid • Ammonia • Dissolved Carbon Dioxide
Concentration Control Glucose in high concentration attaches non-specifically to amino acids. The quality and possibly the quantity of protein product can be increased by maintaining glucose concentration in a bioreactor at physiological levels of about 1 g/L.
Manual Glucose Addition • Typically glucose is added once a day throughout a cell culture run. • The result is a saw-tooth glucose concentration profile that ranges from 3 g/L to near 0 g/L.
Glucose Addition under Feedback Control • Multifunction analyzers can be used in a feed back loop if the sample time is 25% of the dominant system response time. • In line analyzers, like Fogale viability and EP IR perform analysis on each sample within minutes. Their results can be used in most liquid concentration loops.
Benchtop Bioreactor with Sensors • Place picture of bioreactor with sensors here
Tuning of Concentration Loops New concentration Loops are usually Integrators. InSight Learning and Adaptive Tuning can identify these Integrators on in-line analyzers.
Bio-Process Modeling in Process Development • High fidelity modeling can help determine the impact of operating conditions on yield and product quality.
Bioprocess Modeling and Control Chapter 6 of the book “New Directions in Bioprocess Modeling and Control: Maximizing Process Analytical Technology Benefits” describes in detail how to build a model in DeltaV.
Pressure measurement Temperature Measurement Flow measurement Reactor Simulation Valve Simulation Pump Simulation • Simulated Properties • Flow • Temperature • Pressure • Etc. Process simulation blocks Sequential Modular Simulation
Sequential Modular Simulation on DeltaV Michaelis-Menten Rate of synthesis of i by j
Bioreactor Simulation on BioNet Control System • Add picture of simulation here
Bioreactor Control System with Concentration Loops • Place bionet main view here
Actual Plant Actual Batch Profiles Inferential Measurements: Biomass Growth and Production Rates Online KPI: Yield and Capacity Key Actual Process Variables Key Virtual Process Variables Virtual Plant Adaptation Model Parameters Error between virtual and actual process variables are minimized by correction of model parameters On-line Adaptation of Simulation
Process Analytical Technology in Process Development • Dynamic Time Warping allows comparison of matched bioreactors when they progress at different rates. • PCA can weed out unimportant process parameters quickly.
PAT Online in Process Development • Media comparisons • Tech Transfers
References • 1. Kleman G.L.,Chalmers J. J., Luli G W, Strohl W R, A Predictive and Feedback Control Algorithm Maintains a Constant Glucose Concentration in Fed-Batch Fermentations, APPLIED AND ENVIRONMENTAL MICROBIOLOGY, Apr. 1991, p. 910-917 • 2. Luan Y T, Mutharasan R, Magee W E, Effect of various Glucose/Glutamine Ratios on Hybridoma Growth, Viability and Monoclonal Antibody Formation,Biotechnology Letters Vol 9 No 8 535-538 (1987) • 3. McMillan G, Benton T, Zhang Y, Boudreau M, PAT Tools for Accelerated Process Development and Improvement, BioProcessInternational Supplement MARCH 2008. • 4. Boudreau M A, McMillan G K, New Directions in bioprocess Modeling and Control. ISA. Research Triangle Park, NC 2006. • 5. Lee J M, Yoo C K, Lee I B, Enhanced process monitoring of fed-batch penicillin cultivation using time-varying and multivariate statistical analysis. Journal of Biotechnology, 110 (2004) 119-136. • 6. Cinar A, Parulekar S J, Ündey C, Birol G, Batch Fermentation Modeling, Monitoring, and Control. Marcel Dekker, Inc. New York, NY 2003.
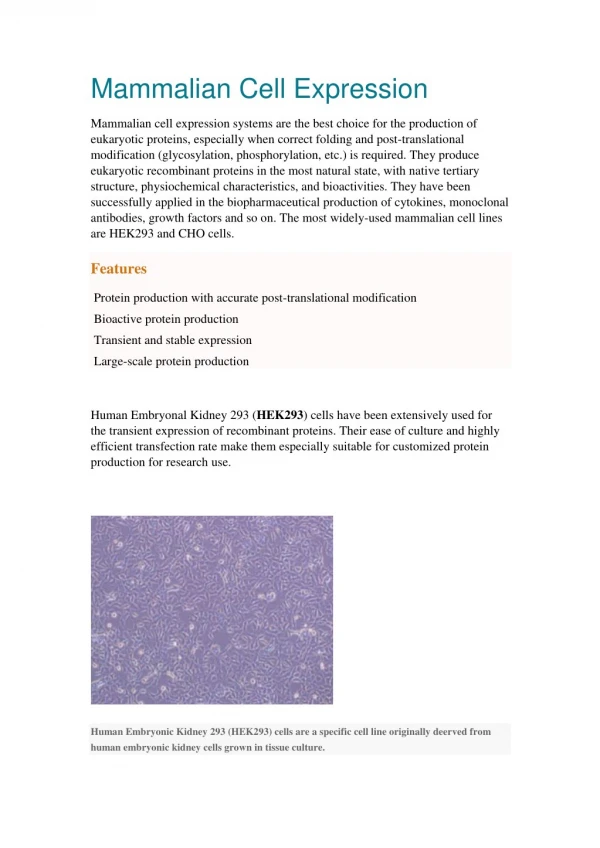
About the Presenters Michael Boudreau is aPrincipal Consultant at Emerson Process Management. Trish Benton is a Life Sciences Consultant at Broadley-James Corporation.