Download
1 / 24
240 likes | 330 Views
Dive into global warming's impact, rising CO2 levels, and individual responsibilities in emissions reduction. Explore statistics on emissions, visualize carbon footprints, and understand the sources of CO2. Discover the global nature of this issue and the countries contributing most to emissions.

E N D
ATM S 111, Global Warming: Understanding the Forecast Dargan M. W. Frierson Department of Atmospheric Sciences Day 4: 04/08/2010
Reading Assignment Should have read “Who’s Responsible” p.32-42 Next assignment: read “Extreme Heat” p.45-57
Today: Who’s Responsible? • How much are average emissions for: • Citizen of the world • Average American • Nations of the world • Which sectors do emissions come from? • Transportation • Electricity generation • Industry • “Carbon efficiency”
Carbon Dioxide vs Other Pollutants • Most pollution is felt near the source • Air quality near urban centers or coal power plants • Water quality near mining, etc • CO2 is not like this! • Since CO2 stays in the atmosphere for so long, everyone’s emissions affect everyone else • Truly a global problem • So it makes sense to think about who’s responsible
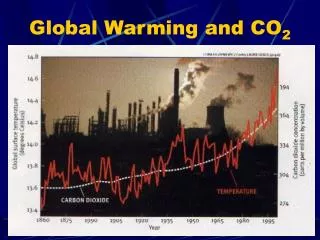
How Much Carbon Dioxide Is There? • Total amount of carbon dioxide in the atmosphere: 3000 gigatonnes • World emissions: over 30 gigatonnes per year • 1 gigatonne = 1 billion metric tons • And one metric ton is a little more than a regular ton (2000 pounds)
Gigatonnes… • Confession: I hate dealing with really big numbers like this • I think they’re hard to put into our everyday experience • Say a company advertises they cut emissions by 500 pounds of CO2 per day: is this a lot or a little?? • It’s important to know the numbers too, but let’s first talk about an easier way to visualize emissions
The “Carbon Blanket” • What if all the CO2 in the atmosphere sank to the surface of the Earth and was in one layer of gas • Forming a carbon blanket all over the globe • It would be 3.2 meters (10.5 feet) thick • Preindustrial (1750) thickness was 2.3 m (7.5 feet) • 1990 thickness was 2.9 m (9.5 feet)
Adding to the Carbon Blanket • Each year we emit the equivalent of 3.2 cm (1.26 inches) to the blanket • A little over a foot per decade…
What Happens to CO2 Emissions? • Not all of those emissions go into the atmosphere though • A little less than 50% does actually… • 25% goes into the ocean • Unfortunately this leads to ocean acidification (a future topic) • 30% goes into land ecosystems • So around 6 inches per decade is added into the blanket…
Pieces of the Blanket: China • We can divide up the quilt into sections based on who’s doing the emitting… • Note: my numbers are from 2006 (CDIAC), while the book uses 2004 data China: 20.2% 6.1 gigatonnes per year Source of images: carbonquilt.org
Pieces of the Blanket: USA • We can divide up the quilt into sections based on who’s doing the emitting… • Note: my numbers are from 2006 (CDIAC), while the book uses 2004 data USA: 19.2% 5.8 gigatonnes per year Source of images: carbonquilt.org
Pieces of the Blanket: Canada • We can divide up the quilt into sections based on who’s doing the emitting… • Note: my numbers are from 2006 (CDIAC), while the book uses 2004 data Canada: 1.6% 0.5 gigatonnes per year Source of images: carbonquilt.org
Pieces of the Blanket: Bangladesh • We can divide up the quilt into sections based on who’s doing the emitting… • Note: my numbers are from 2006 (CDIAC), while the book uses 2004 data Bangladesh: 0.1% 41 million tonnes per year Source of images: carbonquilt.org
Pieces of the Blanket: Somalia • We can divide up the quilt into sections based on who’s doing the emitting… • Note: my numbers are from 2006 (CDIAC), while the book uses 2004 data Somalia: 0.0004% 172 thousand tonnes per year Source of images: carbonquilt.org
National Emissions • Another way to look at national carbon dioxide emissions • Area of each country is made proportional to its emissions Source of images: WorldMapper
Per capita emissions • Note: The book has a typo in the figure on page 41 (columns 2 and 3) • Should be mass of carbon instead of mass of carbon dioxide • Multiply by 3.67 to get the right numbers for mass of carbon dioxide
Our Individual Share: USA • Per capita matters • Some of these countries are so large because they have large populations USA per capita emissions: 19 tonnes per year Over 100 pounds per day
Individual Share: World Average • Per capita matters though • Some of these countries are so large because they have large populations World per capita emissions: 4.6 tonnes per year Over 25 pounds per day
Our Individual Share: Somalia • Per capita matters though • Some of these countries are so large because they have large populations Somalia per capita emissions: 37 kg per year Less than 100 pounds per year
What Makes Up the Emissions? Burning one gallon of gas = 8.7 kg of CO2 Coal and oil makes up 80% of worldwide emissions Oil for transportation Coal for electricity oil
What Makes Up the Emissions? • Primary sources: • Industry: 40% • Transportation: 22% • Buildings: 30% • Agriculture: 4%
US Emissions Sources Electricity: 42% Transportation: 32% Industry: 15% Residential: 6% Commercial: 4% 2008 data, EPA
US Emissions Sources If you distribute electricity use into the other sectors: Transportation: 32% Industry: 27% Residential: 21% Commercial: 19% 2008 data, EPA
Trends in Energy Use • Industry is getting more efficient • Residential is getting worse • Partially due to significantly larger home sizes • Transportation is getting worse • More cars on the roads, longer driving distances