Download
1 / 3
30 likes | 162 Views
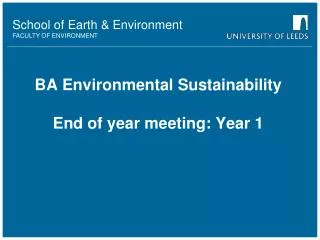
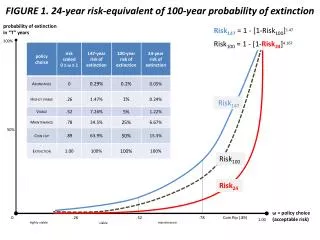
probability of extinction in “T” years. Risk 147 = 1 - [1-Risk 100 ] 1.47. 100%. Risk 100 = 1 - [1- Risk 24 ] 4.167. FIGURE 1. 24-year risk-equivalent of 100-year probability of extinction. Risk 147. 50%. Risk 100. Risk 24. ω = policy choice (acceptable risk). 0. .26. .52. .78.

E N D
probability of extinction in “T” years Risk147 = 1 - [1-Risk100]1.47 100% Risk100 = 1 - [1-Risk24]4.167 FIGURE 1. 24-year risk-equivalent of 100-year probability of extinction Risk147 50% Risk100 Risk24 ω = policy choice (acceptable risk) 0 .26 .52 .78 Coin flip (.89) 1.00 highly viable maintenance viable
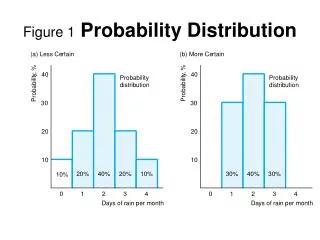
current /desired status extinction risk 1.00 “prospective” actions “historic” ocean FIGURE 2. Integration of ICTRT “viability” & BPA “short-term” risk Risk147 “current “ actions “recent” ocean .50 Risk100 environmental “baseline” “pessimistic” ocean Risk24 1.00 .26 .52 .78 0 coin flip (.89) highly viable maintenance viable Policy choice: What level of extinction risk is acceptable?
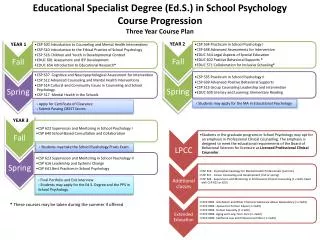
BPA … “short-term” extinction Risk24 = 1 - [1-Risk100].24 • LIFE-CYCLE SURVIVAL (LCS) • IMPROVEMENTS • m = 1, … M “all-H” impacts • 𝜫(Sm ) = “base” or “current” LCS • 𝜫(𝒮m) = “prospective” LCS ICTRT … “viability criteria” Risk100 = 1 - [1-Risk24]4.167 FIGURE 3: Doing “The Math” is easy and fun! (QET=50) TRIBES … “7 generations” Risk147 = 1 - [1-Risk100]1.47 EXTINCTION RISKS (going forward) ω* = {[𝜫(Sm/𝒮m) – α ]/β}1/2 ACCEPTABLE RISK … scaled (0,1) ω = {1 – .1609 log(Risk)} THE GAP … current vs. desired status (revisited) [1+Gapx]-1 = α+βω2 … a lot is left to chance and acceptance of that risk forms the heart of the controversy - Judge Marsh, 1997