Download

1 / 22
220 likes | 358 Views
Runoff Analysis of a 100-Year Flood. Creating a Model Using Data from Another Model. Probing Questions . We’ve looked at the amount of rainfall. Why do you think we should follow that with a discussion of runoff?

E N D
Runoff Analysis of a 100-Year Flood Creating a Model Using Data from Another Model
Probing Questions • We’ve looked at the amount of rainfall. Why do you think we should follow that with a discussion of runoff? • Where does diffusion fit into this picture and why should we be concerned about it? Tropical Storm Allison Recovery Project
Runoff in a 100-Year Storm Now you are ready to determine if there is a functional relationship between the duration of the storm and the amount of runoff that a 100-Year Storm will produce. Tropical Storm Allison Recovery Project
Runoff Assignment • To collect your runoff data, you will need to use the Estimating Runoff Model that you worked with before. You will be using it to determine the amount of runoff in 1 hour, 6 hours, 12 hours, and 24 hours that a 100-Year Storm will produce on three different types of ground cover found in a city. For all the cover types, select Poor for Hydrologic Condition and A for Soil Condition in the model.
Runoff Assignment Continued • Use 3 cover types from the list below, selecting a different combination of 3 for each watershed. You will be using the same two watersheds you worked with in the rainfall model. • If you have time, research each watershed on the Internet to locate maps and other types of descriptions. This information will allow you to determine which of the cover types best describes each region. • Open Urban Areas • Parking Lots • Paved Street with Curb • Paved Street with Open Ditch • Residential
Runoff Assignment Continued Then follow the same basic procedure that you used when comparing the rainfall amounts. Each watershed study must include all of the following list. It must then be copied and pasted into a Word document and turned in or emailed to your teacher. Tropical Storm Allison Recovery Project
Runoff Assignment Continued • 1. Create an Excel spreadsheet for each watershed you have been studying, following the sample on the next slide. • a. Collect the data on the amount of runoff produced by a 100-Year Storm using the Estimating Runoff Model and insert it into Excel. • b. Average the data from the three cover types for each period of time.
Average Runoff in a 100-Year Flood for a Watershed with These Cover Types • Notice that for each period of time, the rainfall amount is a constant. The independent variable is the type of ground cover.
Runoff Assignment Continued • 2. Create a scatterplot graph, following the example in the next slide, with • a. A trendline • b. A regression equation • c. An R-squared value (should be between .9 and 1 to be an accurate model of the data) • d. The function identified, if there is a functional relationship
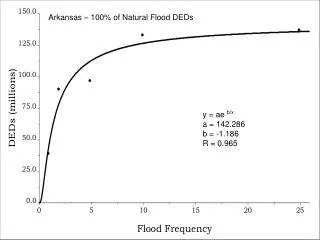
Buffalo Bayou Watershed’s Runoff Scatterplot, Trendline and Regression Equation A Logarithmic Function
Runoff Assignment Continued • 3. Briefly analyze the results by doing each of the following: • a. Describe the function. • b. Identify the type of function. • c. Write it in functional notation. • d. Describe the transformations of the parent function. • e. Give the domain and range of the graph. • f. Evaluate the accuracy of the regression equation. • g. Apply the results to the situation/problem.
Did You Notice A Problem? • The information on runoff as it applies to Tropical Storm Allison is limited. The data we have concerning the rainfall amounts has durations of 1, 12, and 120 hours, while the runoff model will compute only between 1 and 24 hours. Therefore, the runoff model gave us rainfall and runoff amounts for given types of cover based on durations of only 2 times that were common to our rainfall data on Allison. That's not enough to make a reasonable analysis of the data.
A Problem Continued • However, we can resolve this problem and fill in our missing data because we have regression equations which we can solve for the unknown amounts. • Let’s use our data from the rainfall and runoff spreadsheets and paste it into a new spreadsheet to help us better see what data we need to calculate. Tropical Storm Allison Recovery Project
Assignment • Open the runoff spreadsheet. Then copy and paste into a new spreadsheet the cells giving the # of hours and the amount of runoff. • Now open the rainfall spreadsheet and repeat the process, using the # of hours and the amount of rainfall. • Your spreadsheet should look like the one on the following slide.
Runoff and Rainfall Spreadsheet • Notice that our times do not match. • In order to determine if there is a relationship between the amount of runoff and the amount of rainfall, we must have all our times the same. • To accomplish this we’ll rearrange our spreadsheet. It should then look like the next slide.
Spreadsheet Continued • You needed to cut and paste the data for 120 hours and then do the same with the data for 12 hours. Now it is obvious that we need to use our rainfall regression equation to calculate the rainfall for 6 hours and 24 hours. We also need to use the runoff regression equation to calculate the runoff for 120 hours. Complete those calculations and add your answers to the spreadsheet.
Creating the Scatterplot • Now you are ready to create your scatterplot to see if there is a functional relationship between the amount of runoff and the amount of rainfall. As you create your graph, you must decide which is the independent variable. Does the amount of rainfall depend on the amount of runoff or does the amount of runoff depend of the amount of rainfall? • Decide and create your graph. Remember to select the independent variable cells first.
Time to Analyze • When you return to the Allison website, notice that the bar graph for each watershed gives the rainfall during a 100-Year Storm. It says the rainfall is as follows: • 1 hour ≈ 5 inches • 12 hours ≈ 10 inches • 120 hours ≈ 17 inches • How does that compare to our graph? Was it a 100-Year Storm for the Buffalo Bayou Watershed? Why or why not?
Analysis • When we ran the runoff model, we used the 100- Year Storm as the intensity factor. That means that the runoff figures were calculated based on that level of intensity of rainfall over each specified period of time. • For example: We put in the type of ground cover, the hydrologic condition of the soil, the soil type, the amount of hours it rained and the intensity of a 100-Year Storm. Then the model calculated both the amount of rainfall and the amount of runoff.
Analysis Continued • You now have two set of rainfall data for your watersheds. • Why are the amounts different? • Which one do you think is more accurate and why? • In your two watersheds, which do you think had the greater impact on water quality as a result of diffusion, the amount of runoff or the type of ground cover? Tropical Storm Allison Recovery Project