Download
1 / 30
300 likes | 401 Views
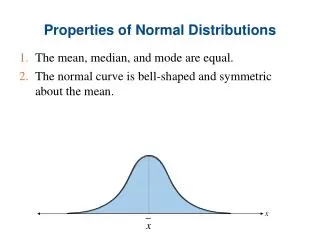
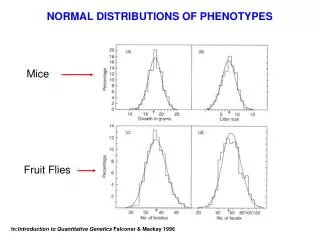
NORMAL DISTRIBUTIONS OF PHENOTYPES. Mice. Fruit Flies. In: Introduction to Quantitative Genetics Falconer & Mackay 1996. MEAN. VARIANCE. CHARACTERIZING A NORMAL DISTRIBUTION. Mean and variance are two quantities that describe a normal distribution.

E N D
NORMAL DISTRIBUTIONS OF PHENOTYPES Mice Fruit Flies In:Introduction to Quantitative Genetics Falconer & Mackay 1996
MEAN VARIANCE CHARACTERIZING A NORMAL DISTRIBUTION Mean and variance are two quantities that describe a normal distribution.
USEFUL PARAMETERS FOR QUANTITATIVE GENETICS • Mean: The sum of all measurements divided by the number of measurements • Variance: The average squared deviation of the observations from the mean
0 — + CORRELATIONS AMONG CHARACTERS OR RELATIVES Covariance:
COMPONENTS OF PHENOTYPIC VARIATION VP = VG + VE • The total phenotypic variance for a character (VP) is a function of: • Genetic variance (VG)– the variance among the mean phenotypes of different genotypes • Environmental variance (VE)– the variance among phenotypes expressed by replicate members of the same genotype • Differences between monozygotic twins are due to environmental factors.
ENVIRONMENTAL VARIATION WITHIN PURE LINES IN: Lynch & Walsh. 1998. Genetics and Analysis of Quantitative Traits. Sinauer Assoc.
COMPONENTS OF GENETIC VARIATION VG = VA + VD + VI • The total genetic variance for a character (VG) is a function of: • Additive genetic variance (VA) – variation due to the additive effects of alleles • Dominance genetic variation (VD) – variation due to dominance relationships among alleles • Epistatic genetic variation (VI) – variation due to interactions among loci
THE COMPONENTS OF PHENOTYPIC VARIANCE VP = VA + VD + VI + VE + VGxE + Cov(G,E) VA = additive genetic variance, VD = dominance variance, VI = epistatic variance, VE = environmental variance. VGxE = Genotype by environment interaction. If the same genotype results in a different phenotype in different environments, then this phenomenon will contribute to the phenotypic variance. Cov(G,E) = The covariance between genotype and environment. If different genotypes consistently end up in different environments, then this covariance will contribute to the phenotypic variance.
DOMINANCE VERSUS ADDITIVE GENETIC VARIANCE • Dominance variance is due to dominance deviations, which describe the extent to which heterozygotes are not exactly intermediate between the homozygotes. • The additive genetic variance is responsible for the resemblance between parents and offspring. • The additive genetic variance is the basis for the response to selection.
RESEMBLANCE BETWEEN RELATIVES • When there is genetic variation for a character there will be a resemblance between relatives. • Relatives will have more similar trait values to each other than to unrelated individuals.
RESEMBLANCE BETWEEN RELATIVES DEPENDS ON THE DEGREE OF RELATIONSHIP y Monozygotic twins Full sibs Parent-offspring Half sibs x Slope of a plot of two variables (x,y) = Cov (x,y) / Var (x)
DEGREE OF RELATEDNESS AND THE COMPONENTS OF PHENOTYPIC COVARIANCE VA = additive genetic variance VD = dominance genetic variance VEs= variance due to shared environment Relationship Phenotypic covariance Monozygotic twins: VA + VD + VEs Parent-offspring ½ VA Full sibs (½ VA) +(¼ VD) +VEs Half sibs, or Grandparent – grandchild ¼ VA
HERITABILITY • The heritability (h2) of a trait is a measure of the degree of resemblance between relatives. h2 = additive genetic variance (VA)/ phenotypic variance (VP) Heritability ranges from 0 to 1 (Traits with no genetic variation have a heritability of 0)
HERITABILITY h2 = VA / VP = VA / (VG + VE) • Since heritability is a function of the environment (VE), it is a context dependent measure. It is influenced by both, • The environment that organisms are raised in, and • The environment that they are measured in.
Method of estimation COV(x,y) h2 Slope (b) Offspring-Single parent ½ VA 2bb = ½ h2 Half-sib ¼ VA 4bb = ¼ h2 Offspring-Grandparent ¼ VA 4bb = ¼ h2 Offspring-Midparent - bb = h2 ESTIMATING HERITABILITY FROM REGRESSION slope = b = Cov (x,y)/Var (x)
HERITABILITIES FOR SOME TRAITS IN ANIMAL SPECIES h2 (%) IN: Falconer & Mackay. Introduction to Quantitative Genetics.1996. Longman.
HERITABILITIES FOR DIFFERENT TYPES OF TRAITS Life history Behavior Physiology Morphology FROM:Mousseau & Roff. 1987.
Response to Selection Selection differential Heritability Where: (Additive Genetic Variance) (Phenotypic Variance) THE UNIVARIATE BREEDERS’ EQUATION: R = h2 S
ARTIFICIAL SELECTION IN DOMESTIC ANIMALS • Grey Jungle fowl
RESPONSE TO SELECTION WHEN h2 = 1/3 • The selection differential (S) = mean of selected individuals – mean of the base population • The response to selection: R = h2S S S
RESPONSE TO SELECTION • For a given intensity of selection, the response to selection is determined by the heritability. High heritability Low heritability
SELECTION ON QUANTITATIVE TRAITS • Stabilizing and directional selection THE ADAPTIVE LANDSCAPE Fitness Phenotypic mean Directional Stabilizing Frequency Phenotypic value
Response to Directional Selection: In:Introduction to Quantitative Genetics Falconer & Mackay 1996