Download
1 / 20
610 likes | 2.73k Views
Properties of Normal Distributions. The mean, median, and mode are equal. The normal curve is bell-shaped and symmetric about the mean. x. Properties of Normal Distributions. 3. The empirical rule applies to normal distributions. Example: Understanding Mean and Standard Deviation.

E N D
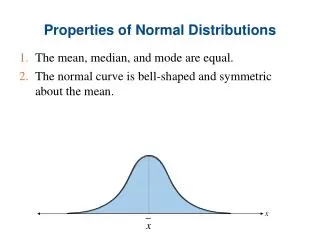
Properties of Normal Distributions • The mean, median, and mode are equal. • The normal curve is bell-shaped and symmetric about the mean. x
Properties of Normal Distributions 3. The empirical rule applies to normal distributions.
Example: Understanding Mean and Standard Deviation • Which curve has the greater mean? Solution: Curve A has the greater mean (The line of symmetry of curve A occurs at x = 15. The line of symmetry of curve B occurs at x = 12.)
Example: Understanding Mean and Standard Deviation • Which curve has the greater standard deviation? Solution: Curve B has the greater standard deviation (Curve B is more spread out than curve A.)
z 0 1 2 3 3 2 1 The Standard Normal Distribution Standard normal distribution • A normal distribution with a mean of 0 and a standard deviation of 1. • Used to compare distributions to each other. Area = 1
Z-scores Any normal distribution can be transformed into a standard normal distribution by using z-scores Any x-value can be transformed into a z-score by using the formula
Z-scores examples Find the z-score of a value of 600 if the mean is 500 and the standard deviation is 100. Find the z-score of a value of 80 if the mean is 100 and the standard deviation is 15.
Example: Using The Standard Normal Table Find the cumulative area that corresponds to a z-score of 1.15. Solution: Find 1.1 in the left hand column. Move across the row to the column under 0.05 The area to the left of z = 1.15 is 0.8749.
Example: Using The Standard Normal Table Find the cumulative area that corresponds to a z-score of -0.24. Solution: Find -0.2 in the left hand column. Move across the row to the column under 0.04 The area to the left of z = -0.24 is 0.4052.
Finding Areas Under the Standard Normal Curve • To find the area to the left of z, find the area that corresponds to z in the Standard Normal Table. Find the area under the standard normal curve to the left of z = -0.99. Solution: 0.1611 z 0.99 0 The area is equal to 0.1611.
1 0.8554 = 0.1446 z 0 1.06 Finding Areas Under the Standard Normal Curve Find the area under the standard normal curve to the right of z = 1.06. • To find the area to the right of z, use the Standard Normal Table to find the area that corresponds to z. Then subtract the area from 1. Solution: 0.8554 The area is equal to 0.1446.
0.8944 0.0668 = 0.8276 z 1.50 0 1.25 Finding Areas Under the Standard Normal Curve Find the area under the standard normal curve between z = 1.5 and z = 1.25. • To find the area between two z-scores, find the area corresponding to each z-score in the Standard Normal Table. Then subtract the smaller area from the larger area. Solution: 0.0668 0.8944 The area is equal to 0.8276.
Probability and Normal Distributions μ = 500 σ = 100 P(x < 600) = Area x μ =500 600 You can find probabilities for any normal distribution by converting the information to z-scores.
Probability and Normal Distributions Normal Distribution Standard Normal Distribution μ = 500 σ = 100 μ = 0 σ = 1 P(x < 600) P(z < 1) z x Same Area μ =500 600 μ = 0 1 P(x < 600) = P(z < 1)
Example: Finding Probabilities for Normal Distributions A survey indicates that people use their computers an average of 2.4 years before upgrading to a new machine. The standard deviation is 0.5 year. A computer owner is selected at random. Find the probability that he or she will use it for fewer than 2 years before upgrading. Assume that the variable x is normally distributed.
Solution: Finding Probabilities for Normal Distributions Normal Distribution Standard Normal Distribution μ = 2.4 σ = 0.5 μ = 0 σ = 1 P(z < -0.80) P(x < 2) 0.2119 z x 2 2.4 -0.80 0 P(x < 2) = P(z < -0.80) = 0.2119
Example: Finding Probabilities for Normal Distributions A survey indicates that for each trip to the supermarket, a shopper spends an average of 45 minutes with a standard deviation of 12 minutes in the store. The length of time spent in the store is normally distributed and is represented by the variable x. A shopper enters the store. Find the probability that the shopper will be in the store for between 24 and 54 minutes.
Solution: Finding Probabilities for Normal Distributions P(-1.75 < z < 0.75) P(24 < x < 54) x z -1.75 24 45 0 Normal Distributionμ = 45 σ = 12 Standard Normal Distributionμ = 0 σ = 1 0.0401 0.7734 0.75 54 P(24 < x < 54) = P(-1.75 < z < 0.75) = 0.7734 – 0.0401 = 0.7333
Example: Finding Probabilities for Normal Distributions Find the probability that the shopper will be in the store more than 39 minutes. (Recall mean = 45 minutes and σ = 12 minutes) 19
Solution: Finding Probabilities for Normal Distributions P(z > -0.50) P(x > 39) x z 39 45 0 Normal Distributionμ = 45 σ = 12 Standard Normal Distributionμ = 0 σ = 1 0.3085 -0.50 P(x > 39) = P(z > -0.50) = 1– 0.3085 = 0.6915