NORMAL DISTRIBUTIONS
NORMAL DISTRIBUTIONS. When the graph a your data looks like this shape then the shape Or distribution of your data is consider mound or bell shaped. (often call a normal distribution ). The distribution for this data is skewed right. Notice to make the black graph look like the blue graph


NORMAL DISTRIBUTIONS
E N D
Presentation Transcript
When the graph a your data looks like this shape then the shape Or distribution of your data is consider mound or bell shaped. (often call a normal distribution)
Notice to make the black graph look like the blue graph You have to push left side of the graph to the right and Pull the right side to the right. So we call this SKEWED RIGHT
MedianMean The distribution for this data is skewed left
Notice to make the black graph look like the blue graph You have to pull left side of the graph to the left and push the right side to the left. So we call this SKEWED LEFT
The median divides the region into to equal areas. The yellow area = the pink area
THE MEDIAN IS THE POINT THAT DIVIDES THE CURVE INTO EQUAL AREAS THE MEAN IS THE BALANCE POINT OF THE DENSITY CURVE IF THE CURVE IS SYMMETRIC THEY BOTH LIE AT THE CENTER OF THE CURVE
DESCRIBE WHERE THE MEAN AND MEDIAN ARE IN EACH OF THESE CURVES ABOVE.
CURVES THAT ARE: SYMMETRIC SINGLE-PEAKED BELL-SHAPED ARE CALLED NORMAL CURVES THEY DESCRIBE NORMAL DISTRIBUTIONS
Empirical Rule We use the empirical rule to describe data that are Bell Shaped
IN A NORMAL DISTRIBUTION: 68-95-99.7 RULE μ IS THE MEAN OF THE DATA AND σ THE STANDARD DEVIATION 68% OF THE DATA FALLS WITHIN σ OF THE MEAN 95% OF THE DATA FALLS WITHIN 2 σOF THE MEAN 99.7% OF THE DATA FALLS WITHIN 3 σ OF THE MEAN
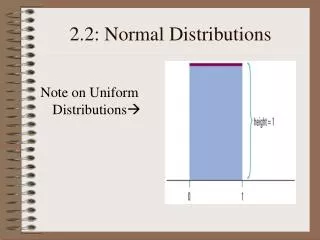
DENSITYCURVERS are use to describe the shape of data. THE CURVE DESCRIBES THE OVERALL PATTERN OF A DISTRIBUTION ALWAYS ABOVE HORIZONTAL AXIS AREA UNDER CURVER IS EXACTLY 1