Normal Distributions
Normal Distributions. AP Statistics. When asked to examine a set of univariate, quantitative data: make a graph Look at the overall pattern Use numbers to describe the center and spread


Normal Distributions
E N D
Presentation Transcript
Normal Distributions AP Statistics
When asked to examine a set of univariate, quantitative data: • make a graph • Look at the overall pattern • Use numbers to describe the center and spread When the data is “regular” enough, the overall pattern can be described by a curve, or mathematical model.
Because the shape of a histogram changes according to the size of the classes we choose, replacing it with a smooth curve eliminates the need for those choices. When the area under that curve is exactly one, the areas under the curve represent proportions of the total area. Any curve under which the area is exactly oneis called a density curve.
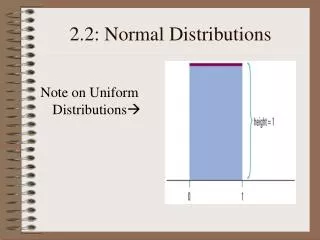
Page 83 #2.2Figure 2.7 displays the density curve of a uniform distribution. The curve takes the constant value 1 over the interval from 0 to 1 and is zero outside the range of values. This means that data described by this distribution take values that are uniformly spread between 0 and 1. Use areas under this density curve to answer the following questions: • Why is the total area under this curve equal to 1? The area under the curve is a rectangle with height 1 and width 1. Thus the total area under the curve = 1 x 1 = 1 b) What percent of the observations lie above 0.8? 20% (The region is a rectangle with height 1 and base width 0.2; hence the area is 0.2) c) What percent of the observations lie below 0.6? • What percent of the observations lie between 0.25 and 0.75? e) What is the mean of this distribution? Mean = ½ of 0.5, the “balance point” of the density curve. 60% 50%
Page 113 #2.38 A certain density curve consists of a straight-line segment that begins at the origin, (0, 0), and has slope 1. (a) Sketch the density curve. What are the coordinates of the right endpoint of the segment? (Note: The right endpoint should be fixed so that the total area under the curve is 1. This is required for a valid density curve.) (b) Determine the median, the first quartile (Q1), and the third quartile (Q3). median = 1. Q1 = .707 Q3 = 1.225 (c) Relative to the median, where would you expect the mean of the distribution? The mean will lie to the left of the median because the density curve is skewed left. (d) What percent of the observations lie below 0.5? Above 1.5? 12.5% of the observations lie below 0.5. None (0%) of the observations lie above 1.5.
The most common density curve is the standard normal distribution model. Normal distributions are symmetric, bell-shaped curves. We describe the center and spread by using the mean and the standard deviation. Symbolically, we represent a distribution that is approximately normal using this symbol: N(µ, σ)
According to the Empirical Rule, in a normal distribution approximately 68% of the data will lie within one standard deviation of the mean, 95% of the data will lie within two standard deviations of the mean, and 99.7% of the data will lie within three standard deviations of the mean.
Caution! • The next three slides contain the answers to the 3 problem practice worksheet regarding the empirical rule. Students should try to answer the questions before viewing the responses!
Practice #1The incubation time for Rhode Island Red chicks is normally distributed with mean of 21 days and standard deviation of approximately 1 day (based on information from World Book Encyclopedia). Sketch a normal curve and answer the following question: If 1000 eggs are being incubated, how many chicks do we expect will hatch • in 19 to 23 days? 95%, 950 eggs (b) in 20 to 22 days? 68%, 680 eggs (c) in 21 days or less? 50%, 500 eggs (d) in 18 to 24 days? (Assume all eggs eventually hatch). 99.7%, 997 eggs
Practice #2A vending machine automatically pour soft drinks into cups. The amount of soft drink dispensed into a cup is normally distributed with a mean of 7.6 oz. and a standard deviation of 0.4 oz. • What percent of the time will the machine overflow an 8-oz. cup? 16% (b) What percent of the time will the machine not overflow an 8-oz. cup? 84% (c) The machine has just been loaded with 850 cups. How many of these do you expect will overflow when served? 136
Practice #3At Burnt Mesa Pueblo, archaeological studies have used the method of tree-ring dating in an effort to determine when prehistoric people lived in the pueblo. Wood from several excavations gave a mean of 1243 years with a standard deviation of 36 years. The distribution of dates was more or less mound-shaped and symmetrical about the mean. • Estimate a range of years centered about the mean in which about 68% of the data will be found. 1207 – 1279 (b) Estimate a range of years centered about the mean in which 95% of the data will be found. 1171 – 1315 (c) Estimate a range of years centered about the mean in which almost all of the data will be found. 1135 – 1351