Download
1 / 8
80 likes | 192 Views
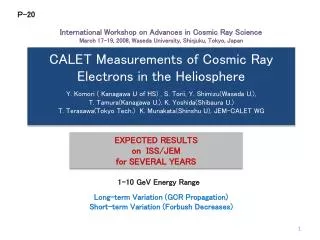
P -20. International Workshop on Advances in Cosmic Ray Science March 17-19, 2008, Waseda University, Shinjuku, Tokyo, Japan.

E N D
P-20 International Workshop on Advances in Cosmic Ray Science March 17-19, 2008, Waseda University, Shinjuku, Tokyo, Japan CALET Measurements of Cosmic Ray Electrons in the HeliosphereY. Komori ( Kanagawa U of HS) , S. Torii, Y. Shimizu(Waseda U.),T. Tamura(Kanagawa U.), K. Yoshida(Shibaura U.)T. Terasawa(Tokyo Tech.) K. Munakata(Shinshu U), JEM-CALET WG EXPECTEDRESULTS onISS/JEM forSEVERALYEARS 1-10GeVEnergy Range Long-termVariation (GCR Propagation) Short-term Variation (ForbushDecreases)
Whatisexpected? Ⅰ. CRPropagationinthe Heliosphere A.Which Model is effective in A>0 period? after 2013Max ⇒ Min(2017) ⇒ Max i.Force-Field ApproximationHeliosphere ~ PotentialField? Φ(Modulation Parameter) -N(Neutron Monitor Count Rate)slope =-0.5 ~ -0.7 ii.Drift Dominated ModelIsDrifteffective? “Steeper”slopeinΦ‐Ncurveinsolarminregion B.Whatvalues of Diffusion Coefficient(D)of GCRelectrons? EnergyDependenceof D ∝ Eαα=“1”orsmaller? “Flatshape” energyspectrumforsmallα(<1) Ⅱ. ForbushDecreases(Fds) WhatdeterminesthemagnitudeofFds?ShocksorCMEs?orBoth? Fdsof “negative”flux will be observed ! ComparisonwithNMprofile ⇒ ChargeSignDependence ? Ⅲ. Measuring 1-10 GeVElectronswith CALET on ISS MeasurementsatHighestLatitude,50°Nand50°S,for5min The Variation of GeomagneticCutoffRigidity Estimatethe electron fluxandthestatisticalerror
Φ–Nrelationship FFApproximation Φ–Nrelationship Slopedφ/dN SolarMin(N=4300) -0.5 ~ -0.6 SolarMax (N=3200) -0.7 ~ -0.8 DriftModel Φ : N ↑ “ - ” : “+” (nega)(posi) “Steeper”? ↑ NMProfile inA>0 Electron:Peak Proton:Flat inSolarMinimum LeftPanel :The correlation between modulation parameter φ and Climax neutron monitor count rate N . ICE 1.2 GeV electron data are estimated from LIS. The thin curves show 11 GV proton curve of FF approximation formula. Right Panel : Similarly shown in the case of Huancayo neutron monitor. The curves show33 GV proton curveofFFapprox. CRPropagationintheHeliosphereLong-termVariationProfileinA>0 ModelComparison Force-Field(FF)Approximation vs. DriftModel TowhichLevelFFApproximation (Sphericalmodel)realized? Whendoes“ChargeDependence(Drift)” appear? The solid line represents the FF approximation at the response energy 11GeV , while the dashed line is an expected curve of negative particles from the drift model in the solar quiet period of A>0, which is just estimated qualitatively.
ElectronModulatedSpectrum Solar Magnetic fieldafter 2010’S Galactic electrons diffuse in the solar magnetic field and convected by solar wind in the heliosphere. The diffusion coefficient is smaller than that in the interstellar space by several orders of magnitude. Modulation EstimatesfromFFApproximation DiffusionCoefficient D ∝ Eα ModulationParameter ΦMeV ~ E1-α
ForbushDecreases(Fds) Two-step decrease: through the passages of the forward shock and the coronal mass ejection EstimatesofFdsareveryImportant! asBackgroundforCRMeasurements Expected Number of Fds (> 4% ) ~ 10 events / 5 yrs Electron(-) SpectralVariationofFdswill contributeNegativeCRMeasurements. The confirmed number ~ 5 events/yr, (7-12 /yr in Solar Max ) From Izmiran NM (55°N) & Climax NM (40°N) in 2000-2004
ElectronMeasurementonISS ISSOrbit - Inclination:51.6° - Altitude:350-400 km FiveminObservation:Latitude50°Nand50°S LongitudinalVariationofCutoffRigidity • ≪ GeomagneticFieldModel≫ • DipoleApproximation • TsyganenkomodelwithIGRF • inbothQuietandActivetimes • (Smart,D.F.,etal.SH3.6.28-2 • Proc.26thICRC,1999)
CALETObservationinGeVRegion(<10 GeV) AtThe HighestAltitude:50°Nand50°S , ObservationTime: 5 min AlternatelyN → S → N → S → N → ‥ every46min Estimates of Cutoff Rigidity Zenith Angle : 30° Azimuth : 0°(North), 90°(East), 180°(South), 270°(West) The cutoff is higher from West direction for negative charged particles TimeVariation ofCutoffRigidity 1 GeV~ 5 GeV
Expected Numbers of Electrons ( < 10 GeV ) • Measurements for Long-Term Variation of Electron Spectrum If the exposure factor is 40 m2・sr・min and the modulation parameter is φ= 500 – 1000 MV , Expected Number of Electrons ~ 17,000 in the energy range of 2 – 12 GeV We divide GeV region into “three“ Energy ranges. Each range has a statistical error of 1 – 2%. Measurements for ForbushDecreases(Fds) If the exposure factor is 5 m2・sr・min, Expected Number of Electrons ~ 2,000 in the energy rang e of 2 – 12 GeV Total number of Northern and Southern measurement of 10min gives statistical error within 2%.