Going Beyond Basic Fleet Safety for Measurable Results
630 likes | 867 Views
Going Beyond Basic Fleet Safety for Measurable Results. Safety & Health Council of Northern New England April 20, 2005. Your Presenter – Paul Farrell. Six years with SafetyFirst, a fleet safety services provider

Going Beyond Basic Fleet Safety for Measurable Results
E N D
Presentation Transcript
Going Beyond Basic Fleet Safety for Measurable Results Safety & Health Council of Northern New England April 20, 2005
Your Presenter – Paul Farrell • Six years with SafetyFirst, a fleet safety services provider • SafetyFirst works with over 5,000 fleets ranging in size from 5 units to over 18,000 units • All industry types represented • Prior thirteen years as safety consultant within the insurance industry
Presentation Overview • Fleet Safety Results • Distribution of Crashes • Claim severity: The Big Four • Fleet Safety Basics • Measuring Results • Going “Beyond The Basics” for Measurable Results
Fleet Safety Results • Motor Vehicle Collisions remain the leading cause of workplace death (USA) • NHTSA states that during CY2000: • 36,249 drivers/passengers died • 3.1 million injuries
Distribution by Vehicle Type • Is there a “disproportionate” number of crashes by private passenger cars or by “truckers”? No – light and medium duty trucks have a lot of crashes, too!
Distribution by Vehicle Type Source - Nat'l Safety Council Accident Facts, 2003
Claim Severity: The Big Four • The crash types • Lane change/merge/sideswipe • Turning & Intersection accidents • Rear-end collisions • Non Collision • These drive 40-70 percent of most firm’s claim expense
Claim Severity: The Big Four • Why isn’t “Fixed Object” one of the “Big Four?” • Good question! There’s no one to sue! (sad, but true…)
Claim Severity: The Big Four • The “Big Four” are typically a source of high-profile jury awards: • Jury Verdict Awards for fleet accidents quadrupled between 1990-2000 • Insurers have been raising rates and deductibles, making safety results even more significant to your profitability Some examples follow…
Byer v. Market Transport • Byer, age 15, suffered irreversible brain damage when the Byer family car was sideswiped by a tractor and trailer. • The jury deliberated one day before delivering its unanimous verdict. $8,132,000 jury verdict for plaintiffs after rejecting a settlement offer of $4.5 million
Nevarez v. Foremost Dairies • A multi-vehicle auto-truck collision that resulted in identical C-5/C-6 quadriplegic injuries to a father and daughter, when their car was rear-ended on smoke-covered I-5 by the defendant's tractor and trailer. $11,000,000.
Bus Crash-Terrell, TX, 6/24/02 • A chartered bus taking youngsters to a church camp crashed into the concrete pillar of an overpass, killing the driver and four passengers “…the families of nine victims have filed a lawsuit against the two bus companies involved in the trip and the company that owned the bus.” (Star-Telegram 08/06/02)
4/18/2005 Collision • A third-grader was killed and 14 other elementary school students were injured when an Arlington County school bus and a trash truck collided yesterday morning, trapping children inside before they were rescued by bystanders and emergency crews • The Washington Times
4/18/2005 Collision Associated Press Photo
4/18/2005 Collision • This was an intersection collision – one of the “big four” crash types • Both drivers are cited as having clean driving records and no prior problems • Clear day, no unusual circumstances noted by press • What happened?
Claim Severity: The Big Four • The cause(s)? • Human error (judgment) • Inattention, Distraction, Fatigue • “at-risk” or “risk-taking” behavior What can be done to address fleet crash results?
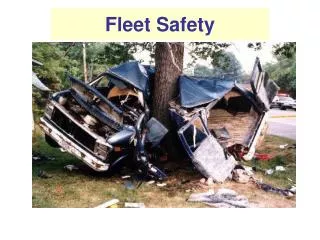
What is “Basic” Fleet Safety? Coordinating the efforts of managers and employees to: • Minimize the potential for collisions • Deal with collisions that do occur • Assure compliance with laws / regulations that apply to your fleet operations
Typical Fleet Safety Details • Recruiting and Hiring drivers • Orientation & Training of drivers • Reporting, recording, investigating and analyzing crash data • Regulatory compliance • Assuring fitness of vehicles • Finding “at-risk” or “high-risk” drivers
Key H.R. and Safety Areas • Driver recruiting and selection practices • New hire evaluation and orientation • Ongoing driver review and training • Post accident reviews and training Business Practices Provide Your Prevention of Claims and “Defense”
Driver Recruiting and Hiring • How do you recruit drivers? • Look at advertising (wording) • Specific requirements and qualifications • Is “driving ability” a core skill? • Up-to-date with pertinent regulations? MVR Review – False Negatives?
KLLM – August 2000 • Plaintiff attorney said KLLM’s driver had: • Eight (8) preventable accidents and six (6) moving violations in the three years before he was hired • and two (2) additional minor accidents and another four (4) tickets in the months immediately before the accident. $6.8 million jury award
KLLM – August 2000 The jury found that KLLM ignored its own standards when it hired the truck driver accused of causing the August 2000 accident $6.8 million jury award
Bus Crash-Terrell, TX, 6/24/02 • the bus driver was twice cited (previously) for driving 90 mph in a 60 zone. • Also, the driver has had at least 8 traffic tickets during the last three years for speeding, speeding in a school zone, driving the wrong way on a one-way street and for not having insurance • NBC TV news report
Evaluation & Orientation • Familiarize newly hired employees with equipment, routes, procedures • Document conversations, receipt of manuals or guidebooks • Periodic review and revision of materials • Deal with concerns now, not later
Evaluation & Orientation • Administration of records for employees is critical • Anniversaries of key dates should not be missed • A system to remind and schedule updates should be put in place
Driver Review and Training • People change over time and so do their habits • Driver review is a periodic revalidation of each driver’s qualifications • As negative habits are discovered, documentation of coaching and training efforts are needed
Driver Review - Options • Periodic management reviews (FMCSR) • Motor Vehicle Report (False Negatives) • 1-800 How’s My Driving? • Electronic On Board Recorders (Black Box) • Supervisory Ride Along
Driver Training • Training can be provided as: • Traditional Classroom • Self-led via Internet, CD ROM, Video, Booklets, etc. • How do you select the “right program”? • How do you document the impact of training?
Driver Training - Footnote • Per FHWA, there were 190,625,023 licensed drivers in the United States in 2000. • If only 1% participate in training @ $40/student , that represents a $76 million/yr industry. (I hope we are saving as much in crashes)
Post Accident Review & Training • Training for drivers and managers on what to do and say following a crash? • What procedures are followed after a crash? • Accident Scene Photos • Accident Report Kit • Prompt contact with company and police
Post Accident Review & Training • How do you handle crashes where your driver is incapacitated? • Who will act on your company’s behalf? • Was there a fatality involved? • Were there passengers, riders or hazardous materials in your vehicle?
Post Accident Review & Training • Crash report: honest, direct & never humor • Consistently review performance of any driver involved in a crash • If system failed, make corrections • If it is clear that the driver needs training to prevent similar accidents get it done
Close the Loop • Do all managers know what is required? • Self Audit of processes and records to assure compliance: “1-800-How’s My Management?” Bottomline = what results are coming from your efforts?
How do you measure safety results? • Insurance carrier loss reports • Annual summary of dollars paid • Dollars by Loss Type • Compliance with regulations • Compliance with training protocols • Crash variance against budget
Do you include WC costs? The most costly lost-time workers’ compensation claims by cause of injury, according to NCCI data, continue to be those resulting from motor vehicle crashes. These injuries averaged more than $27,500 per WC claim.
Justifying Program Changes • There are compelling legal reasons to make or keep safety as a top priority • These same reasons call for measuring compliance to policies and measuring results Negligent Entrustment, Negligent Hiring, Negligent Maintenance
Safety Results at Your Company • Safety results impact the profitability of your firm: • Accident costs are not budgeted • Hidden costs exceed insurance payouts • Deductibles have been rising Fewer collisions = more time on what your company does to make a profit
Satisfied with the Results? • We must master “basic” safety practices, but are we getting the result we want? • Albert Einstein said that the definition of insanity was: “doing the same thing over and over again and expecting different results”
What’s “Different” and Better? • Opportunities exist to capitalize on: “Hi-Tech” Technology Behavior Programs
Technology for Managers • Computerization of record keeping leads to better, deeper reports of activity • Internet-enabled applications help keep multiple locations in lock-step with HQ • Easier measurement of results • Profiling of risk / drivers
Technology for Drivers Black Box Recorders Tied to GPS Automatic Vehicle Location Systems (GPS) TV Cameras for Viewing Behind The Vehicle Sonar Based Collision Detection for Backing and Merging Issues TV Cameras that Record Accidents and Tough Maneuvers Movable, Motorized Mirrors
Needs: Collision Investigation and Documentation Monitor Driver Activity and locations Dispatch of Drivers to Meet Time Deadlines Choices: Black Box Recorder (passive) GPS system (active) Making Sense of Tech Solutions
Cost Justification • Cost of collisions is relatively easy • Don’t underestimate out-of-pocket costs • Judging the impact of the proposed program is much more difficult, but… a good vendor will supply client references, worksheets, & cost options
Cost Justification • Consider a “testing program” to: • Prove that it works • Get driver’s reaction • Gauge the potential loss reductions
Other Technology Tips • Ask a lot of questions • You usually get what you pay for – cheap systems often give ugly solutions • A good vendor will offer real education – be willing to listen • Call clients who already use the system – ask direct questions
90% of Crashes from Behavior • Most collisions are due to driver actions, choices, habits and physical condition • Most collisions could be avoided, IF… • We understood the driver’s attitude or contribution to the collision • We had advance notice of a pending problem
90% of Crashes from Behavior • Most ‘Fleet Safety’ practices are built around “driver training” • Training is good – it is an attempt to: • Show the “right” way to drive • Provide awareness that crashes are “bad” • Help drivers recognize the need to be careful
90% of Crashes from Behavior • Driver training effectiveness depends on: • Participant’s willingness to listen • Presenter’s enthusiasm • Content / message being understood and “agreed to” • The ability of participants to remember the message and apply it – long term