Download
1 / 34
340 likes | 406 Views
Explore if top math abilities translate to STEM fields, addressing gender inequality and recruitment effectiveness. Analyzing data from high school seniors to college graduates in engineering, math, computer science, chemistry, and physics.

E N D
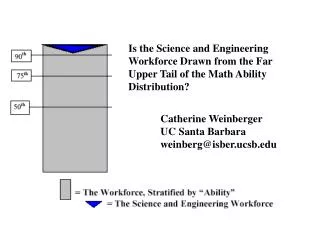
Is the Science and Engineering Workforce Drawn from the Far Upper Tail of the Math Ability Distribution? Catherine Weinberger UC Santa Barbara weinberg@isber.ucsb.edu
“Individuals with the most potential for high academic achievement in mathematics and science . . . are generally considered to be those students who represent the top few centiles in ability, especially mathematics ability.” Benbow and Arjmand (1992), Journal of Educational Psychology “ . . . substantially fewer females than males . . . score in the upper tails of the mathematics and science ability distributions and hence are poised to succeed in the sciences.” Hedges and Nowell (1995), Science “ . . . if we wish to increase the proportion of women in the sciences, we must do something to change the underlying mathematical-attribute distribution.” Paglin and Rufolo (1990), Journal of Labor Economics
Under this model: • Important to recruit most of the capable individuals • Efficiency requires attention to demographic composition
Under this alternative model: • Less concern about efficiency, more concern about equity & diversity of perspectives
Data: Representative Samples of High School Seniors (1972 and 1980 cohorts) Grade 12: Math Score (CTM) 6-7 years later: *Educational Attainment *College Major Earlier Cohort Also Includes: *SAT-Math score *Labor Market Outcomes at Age 32
Definition: EMS: *Engineering *Math *Computer Science *Chemistry *Physics *Astronomy Focus on Bachelor’s College Graduates
White Men White Women 35 % EMS BA Rate
.35 .35
All College Graduates Probability Distribution Functions
EMS College Graduates Probability Distribution Functions 1972 Women 50 75 Math Percentile
Result 1: Most white male EMS participants had 12th grade math scores well below the “top few centiles” 50 75 Math Percentile
Using SAT-M scores instead: Paglin and Rufolo (1990) suggest that EMS participants are drawn from the 651-800 range of SAT-Math scores.
Result 2: Less than one-third of white men in the EMS workforce have SAT-M scores above 650. (Table 3)
Are Lower Scoring Participants REALLY in the Science and Engineering Workforce?
Hourly Earnings at Age 32 Are Lower Scoring Participants REALLY in the Science and Engineering Workforce? Math Score
Maximum Likelihood: Given the observed data, what is the most likely combination of H and l?
Maximum Likelihood: Given the observed data, what is the most likely combination of H and l? If l is near 1, H will be near the 60th percentile: If l is small enough, H might be near the 90th percentile:
Maximum Likelihood: Given the observed data, what is the most likely combination of H and l? Result: l = .20 (quite a bit of unobserved ability) H is at the 78th percentile of the white male ability distribution. (Table 5, column 1)
Other Groups: Actual EMS Participation from Census & Survey of College Graduates Data, Predictions from Base Year HSB Distributions (Preliminary Results)