Download
1 / 22
220 likes | 343 Views
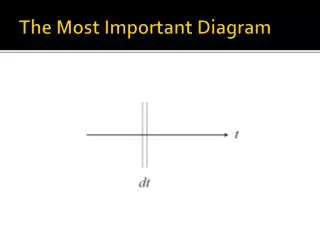
The Most Important Diagram. The Most Simple Model(?). r. S. S. The Most Simple Model(?). r. S. S. This model characterizes how S(t) is changing. The Most Simple Model(?). r. S. S. How many people are susceptible at time = t?

E N D
The Most Simple Model(?) r S S
The Most Simple Model(?) r S S This model characterizes how S(t) is changing
The Most Simple Model(?) r S S How many people are susceptible at time = t? What is S(t) = ? There are a number of approaches…
Approaches • Discrete / Numerical • Analytical • Simulation of stochastic events • Bonus: scheduling events via a stochastic algorithm
The Most Simple Model(?) Approach #1 r S We know that:
The Most Simple Model(?) Approach #1 r S S
The Most Simple Model(?) Approach #1 r S S
The Most Simple Model(?) Approach #1 r S S Discrete (aka “Numerical”)
The Most Simple Model(?) Approach #2 r S S Differential equation This one is not that difficult to solve
The Most Simple Model(?) Approach #2 r S S Solving for S(t) yields: Analytic
The Most Simple Model(?) Approach #3 In each time step, each individual “leaves” S with probability = r S S I2 I3 I1 I4 I5 A population of 10 susceptible Individuals at T0 I10 I6 I8 I9 I7
The Most Simple Model(?) Approach #3 In each time step, each individual “leaves” S with probability = r S • - Generate a random number, U, between • 0 and 1 for each individual • If U > r, individual stays in S • If U < r, individual leaves S • Suppose r = 0.05 S I2 I3 I1 I4 I5 I10 I6 I8 I9 I7 U ~ Uniform on the interval [0, 1]
The Most Simple Model(?) Approach #3 In each time step, each individual “leaves” S with probability = r S S I2 I3 I1 I4 I5 I10 I6 I8 I9 I7
The Most Simple Model(?) Approach #3 In each time step, each individual “leaves” S with probability = r S S S S I2 I2 I3 I3 I1 I1 I4 I4 I5 I5 I10 I10 I6 I6 I8 I8 I9 I7 I9
The Most Simple Model(?) Approach #3 Using indicator variables to denote if an individual is still in “S” S S S S 1 1 1 1 1 1 1 1 1 1 1 1 1 1 1 1 1 0 1 1
The Most Simple Model(?) Approach #3 Repeat for the desired number of time steps to determine S(t) S S S S ? 1 ? 1 ? 1 ? 1 ? 1 ? 1 ? 1 ? 1 ? 0 1 0 Stochastic
A Stochastic Algorithm • If events are happening at a constant rate, l, we can model the time to the next event using an exponential distribution • Recall that the mean of an exponential distribution is 1/l • The c.d.f. is: • F = P(T < t) = 1 – e –lt • Solving for t gives: • t = -ln(1 – P) / l = F-1 Lets see a visual….
Suppose l = 2 We can see, for example, that the probability that we’ll wait more than one unit of time is about 0.2. The probability that we’ll have to wait less than one unit is about 0.8. • P(T < t) = 1 – e –lt
Suppose l = 2 • We can generate a exponentially distributed r. v.’susing the following algorithm: • Generate a uniform r.v. (U) using a random number generator (e.g. in R) • Plug in U in for P in F-1 (U) = -ln(1 – U) / l • The result is a exponentially distributed waiting time • Repeat
Suppose l = 2 • F-1 = -ln(1 – P) / l Mean = 1/2
Multiple events • More than one type of event can occur in most models (e.g. birth, death, infection, recovery) • We can add up the rates of each of these to find out the overall rate that events occur • Use our algorithm to determine the time to the next event (stochastically!) • Randomly select which event occurred (proportional to it’s rate)