Download
1 / 17
170 likes | 429 Views
Using GOME spectrometer to study total column ozone. Natasa Skific www.envsci.rutgers.edu/~nskific Spring 2005. Hypotheses/tasks:. Ozone depletion trend is weakening (as stated by NASA researchers in 1998, as a result of a drop in use of CFC-based aerosols).

E N D
Using GOME spectrometer to study total column ozone Natasa Skific www.envsci.rutgers.edu/~nskific Spring 2005
Hypotheses/tasks: • Ozone depletion trend is weakening (as stated by NASA researchers in 1998, as a result of a drop in use of CFC-based aerosols). • Remote sensing can be used to detect and explore sudden ozone depletions, led by so called “streamer events” (strong gradients in total ozone on horizontal scales of only a few hundred kilometers, believed to be related, at least in part, to weather phenomena in the troposphere). • Explore changes in stratospheric-tropospheric interactions that have occurred over the last decade.
Global Ozone Monitoring Experiment-GOME • Launched on April 21 1995 on board the second European Remote Sensing Satellite (ERS-2). • GOME is a nadir –viewing spectrometer. • Wavelength range from 240 nm to 793 nm. • Resolution of 0.2 nm to 0.33 nm. • Sensor scans across-track in three steps, with field of view varying in size from 120 km (across track) x 40 km (along track) to 960 km x 40 km. • ERS-2 is a sun-synchronous satellite, at altitude of 785 km, with inclination of 98.5º and 100-minute period of each orbit.
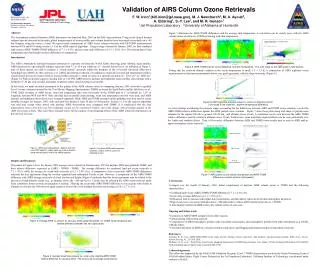
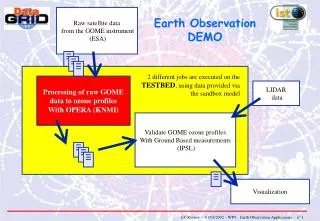
The steps of GOME data processing • Level 1-to-2 Processing: • contains two main algorithms and one 'pre-processing' algorithm. • DOAS fitting technique retrieves Effective Slant Column amounts (ESCs) of trace gases. • AMF algorithm (a radiative transfer computation) generates Air Mass Factors (AMF) for the conversion of slant columns to geometrically independent vertical trace gas columns. • The cloud pre-processing algorithm (ICFA) is a fitting routine designed to compute the fractional cloud cover using GOME measurements. • The results from these three algorithms are combined in the process, which calculates the vertical columns.
Air mass factor and fractional cloud cover calculation • AMF represents the effective enhancement in optical path through the absorbing layer. • AMF depends on solar zenith angle, surface height, surface albedo, month, and latitude bands. • Fractional cloud cover is determined by spectral threshold tests in the visible part of the spectrum.
Calculation of vertical column densities • For a given trace gas, the representative total AMF is determined as the linear combination of AMFs to cloud-top and to ground, weighted with the cloud fractional cover fc provided by ICFA. • The Vertical Column Density (VCD) in units of [mol cm-2] is where ESC is the DOAS slant column, and GVC denotes the 'Ghost Vertical Column', i.e. the column below cloud-top which must be derived from climatological profile information.
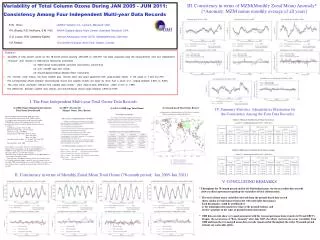
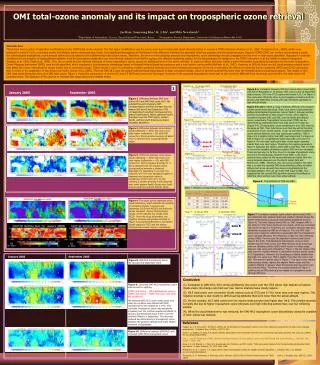
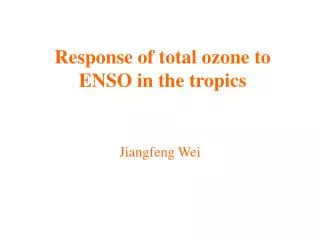
Northern Hemisphere trendsLEFT: GOME total column ozone trends for March 1995-2003;DOWN: ERA-40 March 1979-1993 total column ozone trends.
Southern Hemisphere ozone trends LEFT: ERA-40 October 1979-1993 total column ozone trends.DOWN: GOME total column ozone trends for October 1995-2003;
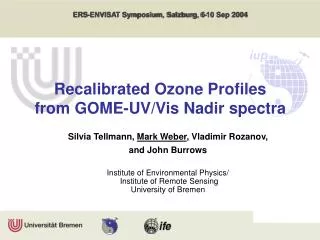
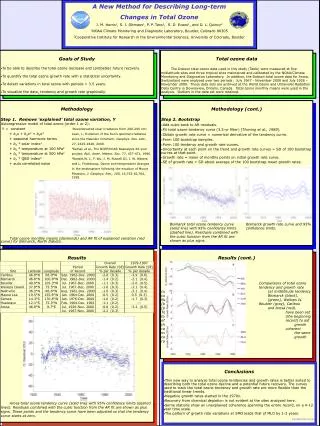
Correlation of DJF AO index and March total column ozone by GOME, for 1995-2002. AO index was derived as the principal component of first EOF of sea-level pressure by ERA-40.
Conclusions • Ozone depletion trends have been weakening in the Southern Hemisphere, whereas in the Northern Hemisphere total ozone has been increasing over the last decade. • Stratospheric-tropospheric interactions have changed over the last decade. Preliminary analysis points out to troposphere as the source of anomalies, propagating into the stratosphere. However more analysis is necessary, as well as the longer period of observations, to confirm these findings.
The steps of GOME data processing • GOME is used for determination of the amounts of atmospheric trace gases. • Level 0-1 Processing: Raw GOME data (level 0) is converted into “calibrated radiance” (level 1), by applying a series of calibration algorithms. The latter are determined (in-flight) on a regular basis during the mission, from GOME observations or from PtCrNe-line-lamp analysis.
O2+hv O3 +hv -> -> O+O O2 +O (1) (3) O+O2 -> O3 (2) Theory of ozone formation and destruction Chapman Reactions HCl + ClONO2 ---- on ice ----> Cl2 (gas) + HNO3 (ice) ClO + NO2 ---> ClONO2 Polar stratospheric clouds O3 + Cl ----> ClO + O2 ClO + O ---> Cl + O2
Mechanisms of anthropogenic radiative forcing and stratosphere-troposphere interactions