Download
1 / 1
10 likes | 151 Views
III. Consistency in terms of MZM(Monthly Zonal Mean) Anomaly* [*Anomaly: MZM minus monthly average of all years]. Variability of Total Column Ozone During JAN 2005 - JUN 2011 : Consistency Among Four Independent Multi-year Data Records

E N D
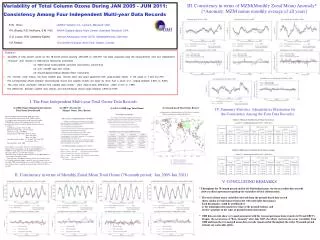
III. Consistency in terms of MZM(Monthly Zonal Mean) Anomaly* [*Anomaly: MZM minus monthly average of all years] Variability of Total Column Ozone During JAN 2005 - JUN 2011: Consistency Among Four Independent Multi-year Data Records E.W. ChiouADNET Systems Inc., Lanham, Maryland, USA P.K. Bhartia, R.D. McPeters, S.M. FrithNASA Goddard Space Flight Center, Greenbelt, Maryland, USA D.G. Loyola, R.M. Coldewey-EgbersGerman Aerospace Center (DLR), Oberpfaffenhofen, Germany V.E.Fioletov Environment Canada, North York, Ontario, Canada 1 • Summary: • Variability of total column ozone for the 78-month period covering JAN 2005 to JUN 2011 has been analyzed using the measurements from four independent • multi-year data records: (1) OMI (Ozone Monitoring Instrument) • (2) SBUV (Solar backscattered ultraviolet instruments) (version 8.6) • (3) GTO (GOME type total ozone) • (4) Ground-based (Dobson+Brewer+Filter) Instruments • For monthly zonal means, the three satellite data records show very good agreement with peak-to-peak offsets in the range of 1.04% to 2.75% . • The corresponding offsets between Ground-based record and satellite records are larger by more than a factor of 2, ranging between 4.86% to 5.82%. • The zonal mean anomalies inferred from satellite data records show peak-to-peak differences within 0.70% to 1.98%. • The differences between satellite data records and Ground-based record range between 3.99% to 5.96%. I. The Four Independent Multi-year Total Ozone Data Records OMI (Ozone Monitoring Instrument) Total Ozone Data Record (2) SBUV (Version 8.6) Merged Ozone Data Record (4) Ground-based Total Ozone Record (3) GTO (GOME-type Total Ozone) IV. Summary Statistics (Quantitative Illustration for the Consistency Among the Four Data Records) The Ozone Monitoring Instrument (OMI) aboard the NASA Earth Observing System (EOS) AURA satellite is a compact nadir viewing, wide swath, ultraviolet-visible (270-500 nm) hyperspectral imaging spectrometer that provides daily global coverage with high spatial and spectral resolution. Satellite Launch Date: JUL 15, 2004 Equator Crossing Time: 13:45 local time Spectral Coverage: 270-500 nm Average Spectral Resolution: 0.63 nm (UV-1) 0.42 nm (UV-2) 0.63 nm (VIS) Ground Pixel Size at nadir: 13 x 24 km2 (UV-2 and VIS) 14 x 48 km2 (UV-1) Data Start Date: AUG, 2004 Total column ozone products have been retrieved using two different retrieval algorithms: (a) the modified TOMS version 8 (TOMS v8.5) algorithm, and (b) the Differential Optical Absorption Spectroscopy (DOAS) technique. The data records used in this study are based on the OMI TOMS v8.5 total column ozone data products. “Row Anomaly” first appeared in June 2007 at cross-track positions 53-54 and the anomaly began to expand to other cross-track positions since May 2008. Anomaly Flags are provided in OMI total column ozone level-2 data product to indicate the measurements affected by the row anomaly. II. Consistency in terms of Monthly Zonal Mean Total Ozone (78-month period; Jan 2005-Jun 2011) V. CONCLUDING REMARKS * Throughout the 78-month period and for all 4 latitudinal zones, the three satellite data records show excellent agreement regarding the variability of total column ozone. * The total column ozone variability inferred from the ground-based data record shows similar overall characteristics but with noticeable discrepancy Such discrepancy could be attributed to: (i) the inhomogeneous spatial coverage of the ground stations, and (ii) the variations in the types of ground station instruments. * OMI data records show very good agreement with the two merged ozone data records (GTO and SBUV). Despite the occurrence of “Row Anomaly” after July 2007, the offsets between the ozone variability from OMI and from the two merged ozone data records remain stable throughout the entire 78-month period without any noticeable drifts. . V. CONCLUDING REMARKS: