Download
1 / 1
10 likes | 144 Views
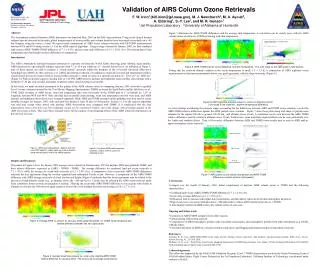
Validation of AIRS Column Ozone Retrievals F. W. Irion 1 (bill.irion@jpl.nasa.gov), M. J. Newchurch 2 , M. A. Ayoub 2 , A. Eldering 1 , S.-Y. Lee 1 , and M. R. Gunson 1 1 Jet Propulsion Laboratory 2 University of Alabama at Huntsville. National Aeronautics and Space Administration

E N D
Validation of AIRS Column Ozone Retrievals F. W. Irion1 (bill.irion@jpl.nasa.gov), M. J. Newchurch2, M. A.Ayoub2, A.Eldering1, S.-Y.Lee1, and M. R. Gunson1 1Jet Propulsion Laboratory 2University of Alabama at Huntsville National Aeronautics and Space Administration Jet Propulsion Laboratory California Institute of Technology Pasadena, California Jet Propulsion Laboratory California Institute of Technology Abstract The Atmospheric Infrared Sounder (AIRS) instrument was launched May, 2002 on the EOS Aqua platform. Using cloud-cleared thermal radiance spectra observed in the nadir, global measurements of ozone profiles and column densities have been made twice-daily on a ~45 km footprint using the ozone n3 band. We report initial comparisons of AIRS ozone column retrievals with EP-TOMS measurements between 40°S and 40°N using version 3.1.9 of the AIRS retrieval algorithm. Using average columns for January, 2003, we find combined land+ocean (AIRS–TOMS)/TOMS difference of 7.1 ± 4.5%, and an ocean-only difference of 6.1 ± 3.0% (1s). The relationship of skin temperature and cloud height on these differences is summarized. Figure 5 illustrates the AIRS-TOMS differences and the average skin temperature. A correlation can be clearly seen, with the AIRS column retrieval relative to TOMS increasing with skin temperature. AIRS - TOMS TOMS AIRS-TOMS diff vs. skin temperature Skin temperature Note: truncated vertical scale Introduction The AIRS (Atmospheric Infrared Sounder) instrument is currently on board the NASA Earth observing, polar orbiting Aqua satellite. AIRS measures the upwelling IR radiance spectrum from 3.7 to 15.4 mm within its 1.1° internal field-of-view. As indicated in Figure 1, nine of these spectra are used to produce a “cloud-cleared” spectrum within the footprint of the co-located Advanced Microwave Sounding Unit (AMSU-A) (See Aumann et al. [2003] and references therein.) In addition to retrievals of water and temperature profiles, cloud-cleared spectra are used to retrieve ozone profiles using the n3 band of ozone at a spectral resolution of ~ 0.85 cm-1 at ~1040 cm-1 (Figure 2.) With an daytime equator crossing time of 1:30 PM, AIRS retrieves daytime and nighttime ozone profiles and columns with a footprint of ~45 km wide at nadir, and under conditions where cloud-clearing is successful. In this study, we make an initial assessment of the quality of the AIRS column ozone by comparing January, 2003 retrievals to gridded Level 3 ozone columns retrieved by the Total Ozone Mapping Spectrometer (TOMS) on board the Earth Probe satellite [McPeters et al., 1998]. Daily averages of AIRS ozone, cloud and temperature data were first made on the TOMS grid of 1° in latitude by 1.25° in longitude, between 40°S and 40°N. Only data that had successful cloud-clearing, water and temperature retrieval were used, and AIRS daytime and nighttime observations were averaged separately. Daily AIRS and TOMS averages on this gridding were then used to create monthly averages for January, 2003, with each grid box having at least 10 days of observation. Version 3.1.9 of the retrieval algorithm was used and, except where noted, only daytime AIRS observations were compared with TOMS. It is emphasized that the land temperatures shown here have not been validated, should not be considered reliable, and could change with upcoming updates to the AIRS processing scheme. They have been included solely for the purpose of investigating effects of the AIRS retrieved temperatures on the retrieval of ozone. Figure 5: AIRS-TOMS column ozone difference, and skin temperature. The color scale on the right graph is land fraction. Noting that the retrieved diurnal variation in the ocean temperature is small, 1.5 ± 1.3 K, a comparison of AIRS nighttime ocean measurements to daytime measurements shows very good agreement, with the slope near unity (Figure 6.) Figure 6: AIRS nighttime average ocean O3 column vs daytime column. Color scale is the nighttime - daytime temperature difference. As a first attempt at deducing the pressure ranges accounting for the differences between AIRS and TOMS ozone columns, we plot the AIRS-TOMS relative differences against the AIRS partial ozone columns. Figure 7 show these plots along with maps of partial ozone columns for the regions 300 mb to ground, 100-30 mb, and altitudes above 30 mb. A correlation can be seen between the AIRS-TOMS relative differences and the column at altitudes above 30 mb. Furthermore, some unrealistic regional effects can be seen, particularly over the Andes and southern Africa. Thus, to first order, differences between AIRS and TOMS ozone results tend to arise in AIRS mid-to-upper stratosphere ozone retrievals. AIRS partial ozone column AIRS/TOMS difference vs Partial Column 300 mb to ground Figure 1: AIRS scanning geometry. Spectra from the nine AIRS footprints (upper right) are used to produce cloud-cleared spectra within the AMSU footprint. Figure 2: Synthetic AIRS partial spectrum. Channels used to retrieve ozone are indicated in cyan. 100 to 30 mb Results and Discussion The panels in Figure 3 show the January 2003 average ozone column (in Dobson units, DU) for daytime AIRS and (gridded) TOMS, and their relative difference expressed as (AIRS - TOMS) / TOMS. The average difference for combined land and ocean retrievals is 7.1 ± 4.5%, while the average for ocean-only retrievals is 6.1 ± 3.0% (1s). A comparison of the ocean-only AIRS-TOMS differences indicates the best agreement along the western equatorial and subtropical Pacific ocean. However, a comparison of the AIRS-TOMS difference with AIRS average retrievals of cloud fraction and height (Figure 4) indicates that this better agreement may be related to the presence of high-altitude clouds (e.g., at altitudes above the ~300 mb level.) Clouds may be affecting the AIRS ozone retrieval under these conditions, however more investigation is needed. Filtering the ocean-only AIRS-TOMS difference to use regions with clouds at altitudes at or below the 300 mb level again results in a bias with a low standard deviation (an average of 6.8 ± 2.7 %, 1s). 30 mb to top of atmosphere Figure 7: AIRS partial ozone column (left panels) and AIRS-TOMS difference vs partial column (right panels). Conclusions: Averaged over the month of January, 2003, initial comparisons of daytime AIRS column ozone to TOMS had the following characteristics: • Combined land+ocean (AIRS-TOMS)/TOMS difference is 7.1 ± 4.5% (1s). • Ocean-only average difference is 6.1 ± 3.0% (1s). • Differences tend to increase with higher skin temperatures, and this affects retrievals in the mid stratosphere and above. • High cloud cover over ocean (altitudes above ~300 mb) tends to reduce AIRS column retrievals w.r.t. TOMS. • Little diurnal variation in AIRS ocean-only column retrievals was seen. Ongoing and future work: • Extension of AIRS/TOMS comparisons to other seasons. • Characterizing effects from aerosols. • Comparisons of AIRS tropospheric profiles with coincident ozonesondes, and stratospheric profiles from other instruments (e.g. SAGE, Umkehr, lidar). • Full characterization of AIRS O3 vertical resolutions and errors, and flagging and characterization of unrealistic retrievals. References Aumann, H. H. et al., AIRS/AMSU/HSB on the Aqua mission: Design, science objectives, data products, and processing systems, IEEE Trans. Geosci. Remote Sensing, 41, 253-264, 2003. McPeters, R. D. et al., “Earth Probe Total Ozone Mapping Spectrometer (TOMS) Data Products User Guide,” NASA Technical Publication 1998-206895, NASA Goddard Space Flight Center, Greenbelt MD, 1998. Acknowledgements This effort was supported by the NASA EOS Validation Program. Level 3 TOMS data products are from the Ozone Processing Team of NASA/Goddard Space Flight Center. Research at the Jet Propulsion Laboratory, California Institute of Technology is performed under contract to NASA. AIRS TOMS AIRS - TOMS TOMS Figure 3: Average AIRS O3 column for January, 2003 (upper left panel), for TOMS (lower left panel) and relative difference between the two (right panel). Figure 4: Average cloud top pressure vs. ocean-only, daytime AIRS-TOMS relative difference for January 2003. The color scale is average cloud fraction.