Download
1 / 1
10 likes | 143 Views
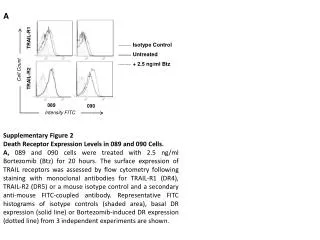
A. TRAIL-R1. Isotype Control Untreated + 2.5 ng/ml Btz. Cell Count. TRAIL-R2. 089. 090. Intensity FITC. Supplementary Figure 2 Death Receptor Expression Levels in 089 and 090 Cells.

E N D
A TRAIL-R1 Isotype Control Untreated + 2.5 ng/ml Btz Cell Count TRAIL-R2 089 090 Intensity FITC Supplementary Figure 2 Death Receptor Expression Levels in 089 and 090 Cells. A, 089 and 090 cells were treated with 2.5 ng/ml Bortezomib (Btz) for 20 hours. The surface expression of TRAIL receptors was assessed by flow cytometry following staining with monoclonal antibodies for TRAIL-R1 (DR4), TRAIL-R2 (DR5) or a mouse isotype control and a secondary anti-mouse FITC-coupled antibody. Representative FITC histograms of isotype controls (shaded area), basal DR expression (solid line) or Bortezomib-induced DR expression (dotted line) from 3 independent experiments are shown.