
Uploaded by
didier
1 SLIDES
95 VIEWS
10LIKES
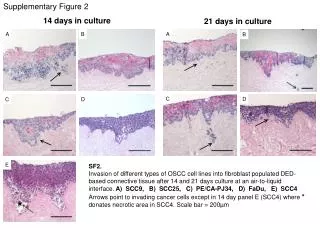
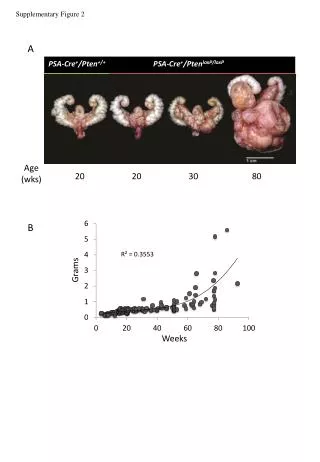
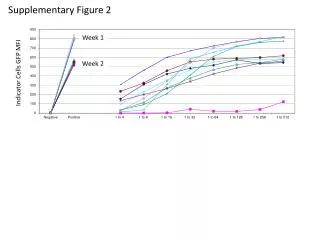
Comparison of OSCC Cell Invasion into Connective Tissue after 14 and 21 Days
DESCRIPTION
Explore invasion of SCC9, SCC25, PE/CA-PJ34, FaDu, and SCC4 cells into fibroblast-populated DED-based tissue at the air-liquid interface. Detailed analysis after 14 and 21 days, observing cancer cell invasion. Scale bar = 200µm.
Download
1 / 1
Download Presentation 
Comparison of OSCC Cell Invasion into Connective Tissue after 14 and 21 Days
An Image/Link below is provided (as is) to download presentation
Download Policy: Content on the Website is provided to you AS IS for your information and personal use and may not be sold / licensed / shared on other websites without getting consent from its author.
Content is provided to you AS IS for your information and personal use only.
Download presentation by click this link.
While downloading, if for some reason you are not able to download a presentation, the publisher may have deleted the file from their server.
During download, if you can't get a presentation, the file might be deleted by the publisher.
E N D
Presentation Transcript
Supplementary Figure 2 14 days in culture 21 days in culture A B A B C D C D E SF2. Invasion of different types of OSCC cell lines into fibroblast populated DED-based connective tissue after 14 and 21 days culture at an air-to-liquid interface. A) SCC9, B) SCC25, C) PE/CA-PJ34, D) FaDu, E) SCC4 Arrows point to invading cancer cells except in 14 day panel E (SCC4) where * donates necrotic area in SCC4. Scale bar = 200µm *


More Related
Audio
Live Player