Download
1 / 30
300 likes | 437 Views
Maine Electricity and Waste Inventory, Baseline and Model Inputs. The Center for Clean Air Policy March 8, 2004. Presentation for Working Group, Meeting #2. Detailed breakdown of waste inventory Discussion of NEMS model inputs Natural gas prices

E N D
Maine Electricity and Waste Inventory, Baseline and Model Inputs The Center for Clean Air Policy March 8, 2004
Presentation for Working Group, Meeting #2 • Detailed breakdown of waste inventory • Discussion of NEMS model inputs • Natural gas prices • Population and economic forecast for electricity demand • Cost and performance of generating units • Renewable supply curve CCAP
Waste Inventory 1990-2000 45% 28% Note: Target level is for illustrative purposes only, and does not represent a mandated target.Target line assumes targets of 1990 sector levels by 2010, 10% below 1990 in 2020 CCAP
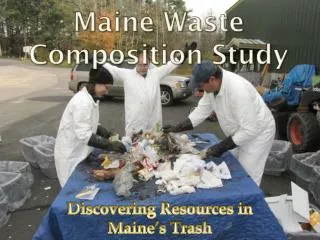
Waste Inventory: Methodology • Developed by NESCAUM using the US EPA Inventory tool and state-specific information • Inventory includes all waste that was landfilled or burned in Maine. Includes emissions from waste imports but not exports. • Sources of waste emissions in inventory appear on the following slide. CCAP
Waste Inventory: Methodology • Landfills • Total tons of waste landfilled taken from biannual Solid Waste Generation and Disposal Capacity Report from the State Planning Office. • Number of landfills (447) and number of large landfills (3) provided by Maine DEP. Large landfills are those with at least 1.1 million tons of waste in place. • Accounts for methane emitted and flared using defaults • Accounts for oxidation of methane, based on EPA estimates that 10% of methane is oxidized (converted) in the top layer of soil cover above the landfill • Incineration • Total tons of municipal solid waste (MSW) burned at Maine’s four MSW-to-energy plants provided by DEP. • 100% of emissions from electricity from MSW plants included in waste inventory • Emissions from plastics use national defaults CCAP
Waste Inventory: Methodology • Industrial waste • Industrial landfill emissions are included. Inventory Tool default assumes industrial emissions are equal to 7% (national default) of total MSW methane emissions. • Wastewater • Includes municipal wastewater emissions only. Does not include industrial emissions, which are expected to be small. CCAP
Waste Inventory: Pulp and Paper Waste • Most pulp and paper waste is stored or burned on-site, and is not included in waste inventory. Is accounted for in forest sector through net carbon emitted or stored. • Any pulp and paper waste sent to municipal landfills or MSW plants would be included in waste inventory. This quantity is expected to be small. • Paper incineration in MSW plants: CO2 emissions from biomass content of paper are not included in the inventory. CO2 from petroleum content and N2O emissions from both biomass and petroleum content are included. CCAP
NEMS Model Inputs • Natural gas prices • Population and economic forecast for electricity demand • Cost and performance of generating units • Renewable supply curve CCAP
Natural Gas Price Forecasts • The following slides display natural gas price forecasts from the following sources: • EIA’s Annual Energy Outlook 2004 • An alternative forecast by a respected independent firm • New York Mercantile Exchange • Prices have been adjusted to the Henry Hub value CCAP
Maine Electricity Demand Allocation • NEMS provides results at the regional level, so demand must be allocated to states • Tellus algorithm allocates demand from region to state using state share of population (for residential and private transportation) and gross state product (for commercial and industrial sectors and freight transport) • State demand can therefore be changed through selection of state population and gross state product inputs (annual estimates or average growth rates) CCAP
NEMS Cost and Performance Data: New England Fossil Units CCAP
NEMS Cost and Performance Data: New England Non-Fossil Units CCAP
Maine Supply Curve for New Renewables: Methodology • Includes wind, landfill gas, biomass integrated gasification combined cycle (IGCC) and direct-fired biomass • Assumes no additional hydro capacity is available for development • Assumes no new MSW incineration plants will be built CCAP
Wind: Sources and Assumptions • Methodology based on procedure used for Connecticut GHG analysis. This methodology has been examined by IEPM and a Maine wind developer, and incorporates information provided by the developer. • Potential wind capacity in Maine (8,205 MW) taken from National Renewable Energy Laboratory (NREL) assessment, True Wind Solutions for New England • Costs estimated using class 5 wind projects. Capital cost, variable operation and maintenance (O&M) and fixed O&M costs for 2005 developed using an average of costs provided by NREL and another set taken from EIA’s Annual Energy Outlook 2004. • Assumes constant capacity factor of 35%, based on input from Maine wind developer • Federal wind production tax credit assumed to continue through 2020 CCAP
Wind: Sources and Assumptions • Costs for 2010 and 2020 developed assuming a 3% drop in capital cost every five years, based on input from Maine wind developer • Based on the expectations of New York developers for Northeast wind that were used for the Connecticut GHG analysis, it was assumed that 75% of the wind potential identified by NREL would be prohibitively expensive (twice the capital cost). In Maine this would therefore apply to 6,154 MW. • For the remaining 25% (2,051 MW total), a step function was created to estimate the increasing costs of wind that would be associated with variable interconnection and permitting costs: • Step 1: 574 MW available at 100% of the base capital cost • Step 2: 328 MW available at 110% of the base capital cost • Step 3: 328 MW available at 125% of the base capital cost • Step 4: 821 MW available at 150% of the base capital cost CCAP
Landfill Gas: Sources and Assumptions • Total potential capacity (19 MW) in Maine provided by Maine DEP to LMOP • Cost and performance data for landfill gas electric generation units provided by US EPA Landfill Methane Outreach (LMOP) program CCAP
Biomass Gasification: Sources and Assumptions • Data on estimated supply and costs of biomass in Maine taken from study commissioned by the Northeast Regional Biomass Program (NRBP) of Coalition of Northeast Governors: Securing a Place for Biomass in the Northeast United States: A Review of Renewable Energy and Related Policies, prepared by Xenergy for CONEG Policy Research Center, Inc., NRBP, March 31, 2003 • Categories of biomass included: Forest Residues, Primary Mill Wastes, Tree Residue • Study provides quantities of biomass available in each category for <$1.40/MMBtu and <$3.50/MMBtu • Gasification unit cost and performance data (for New England) taken from EIA NEMS model CCAP
Direct-Fired Biomass: Sources and Assumptions • Data on estimated supply and costs of biomass in Maine taken from study commissioned by the Northeast Regional Biomass Program (NRBP) of Coalition of Northeast Governors: Securing a Place for Biomass in the Northeast United States: A Review of Renewable Energy and Related Policies, prepared by Xenergy for CONEG Policy Research Center, Inc., NRBP, March 31, 2003. • Categories of biomass included: Forest Residues, Primary Mill Wastes, Secondary Mill Wastes, Tree Residue, Urban Wood Wastes • Study provides quantities of biomass available in each category for <$1.40/MMBtu and <$3.50/MMBtu • Direct-fired biomass cost and performance data (national) taken from US Department of Energy and EPRI, Renewable Energy Technology Characterizations, December 1997 CCAP