Maine Greenhouse Gas Inventory Analysis (1990-2000)
140 likes | 274 Views
This report presents an overview of Maine's greenhouse gas (GHG) emissions from 1990 to 2000. It highlights a net increase of 3.66 MMTCO2E (+14.2%) in emissions, primarily from fossil fuel combustion, which accounts for ~70% of total GHG emissions. Key contributors include transportation, which relies heavily on oil. Industrial processes, landfill emissions, and agricultural activities also impact GHG levels. The study emphasizes the need for better data on emissions sources and recovery opportunities, particularly in land use and forestry.

Maine Greenhouse Gas Inventory Analysis (1990-2000)
E N D
Presentation Transcript
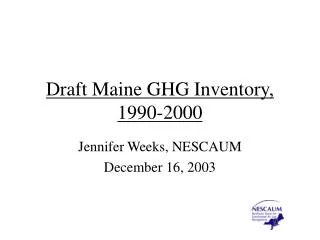
Draft Maine GHG Inventory, 1990-2000 Jennifer Weeks, NESCAUM December 16, 2003
ME GHG Emissions, 1990-2000 • 1990:25.68 MMTCO2E • 2000: 29.34 MMTCO2E (net increase = 3.66 MMTCO2E, +14.2%)
Fossil Fuel Combustion • FFCO2 is ~70% of state GHG emissions • Transportation dominates • Oil accounts for ~90% of FFCO2 emissions throughout decade • Electric power estimate includes power from CHP facilities
Fossil Fuel Combustion, cont. • Other gases from fossil fuel combustion (CH4, N2O) in mobile and stationary sources account for ~2.5% of total ME GHG emissions
Industrial Processes • Emissions rise from 1.4% of inventory in 1990 to ~2.4% in 2000, partially from HFCs, PFCs, and SF6; HFC/PFC use likely to keep rising as U.S. phases out ozone-depleting substances • Sources include refrigeration, insulation, semiconductor manufacturing
Natural Gas and Oil Activities • Natural gas transmission and distribution are only ME activities (no production or processing) • Emissions ~0.2% of total state GHGs/year in 2000 (not much pipeline and low gas penetration in ME)
Landfills and Waste Combustion • Accounts for 2-3% of state GHG emissions throughout decade • More data needed on MSW imports/exports to see what fractions ME is sending out of state and receiving from other states • Landfill methane recovery opportunities? (no Federal information available)
Municipal Wastewater Treatment • About 0.3% of annual GHG emissions through 1990s • Wastewater emissions from pulp and paper industry should be considered – need annual production data (Already addressed)
Agriculture • Includes enteric fermentation, manure management, soil management (fertilizer application, growth of nitrogen-fixing plants, etc.) • Total agriculture emissions <2% of annual state emissions throughout decade
Land Use Change and Forestry • Includes practices that alter land use (e.g., clearing forests, developing wetlands) or affect the amount of carbon or biomass in existing forest or soil stocks (liming of soils, landfilling yard waste, etc.) • Major activity for ME is forest carbon flux (uptake of carbon in plants, soils, forest floor and debris); based on U.S. Forest Service estimates of carbon stored in forests
Land Use/Forestry, cont. • EPA inventory software estimates forests and land-use change to be a major GHG source for ME (20-25% of annual GHG emissions throughout decade); may reflect many factors, inc. harvest rates, age of forest stocks, data collection methods • ME DEP is exploring alternate estimation methodologies