Impact of shRNA Knockdown on Cell Aneuploidy and Viability
Analysis of HeLa cell response to shRNA transfection, nocodazole treatment, and co-treatment with Z-VAD-FMK, Cisplatin, and Rapamycin; evaluating cell population distribution, DNA content, aneuploidy, and viability.

Impact of shRNA Knockdown on Cell Aneuploidy and Viability
E N D
Presentation Transcript
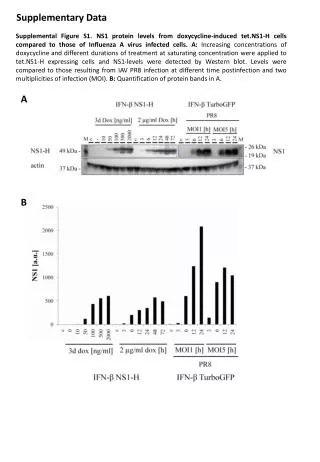
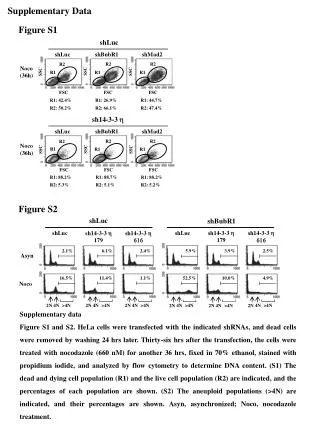
Supplementary Data Figure S1 Figure S2 shLuc shLuc shBubR1 shLuc shBubR1 shMad2 R2 R2 shLuc sh14-3-3 h 179 sh14-3-3 h 616 shLuc sh14-3-3 h 179 sh14-3-3 h 616 R2 Noco (36h) SSC SSC SSC R1 R1 R1 2.1% 2.4% 5.9% 3.9% 2.5% 6.1% Asyn FSC FSC FSC R1: 42.4% R1: 26.9% R1: 44.7% R2: 50.2% R2: 66.1% R2: 47.4% 16.5% 11.4% 1.1% 52.5% 10.0% 4.9% Noco sh14-3-3 h shLuc shBubR1 shMad2 4N >4N 4N >4N 4N >4N 2N 2N 2N 4N >4N 4N >4N 4N >4N 2N 2N 2N R2 R2 R2 Noco (36h) R1 SSC R1 R1 SSC SSC FSC FSC FSC R1: 88.2% R1: 88.7% R1: 88.2% R2: 5.3% R2: 5.1% R2: 5.2% Supplementary data Figure S1 and S2. HeLa cells were transfected with the indicated shRNAs, and dead cells were removed by washing 24 hrs later. Thirty-six hrs after the transfection, the cells were treated with nocodazole (660 nM) for another 36 hrs, fixed in 70% ethanol, stained with propidium iodide, and analyzed by flow cytometry to determine DNA content. (S1) The dead and dying cell population (R1) and the live cell population (R2) are indicated, and the percentages of each population are shown. (S2) The aneuploid populations (>4N) are indicated, and their percentages are shown. Asyn, asynchronized; Noco, nocodazole treatment.
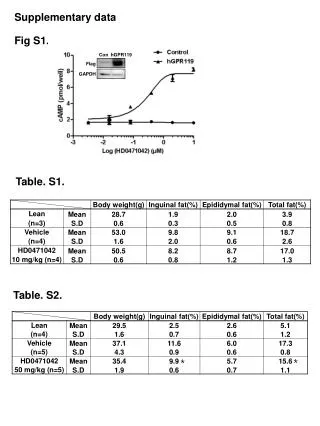
Supplementary Data Figure S3 w/ or w/o Z-VAD-FMK w/ Mock vector w/ Bcl2 expressing vector Supplementary data Figure S3. HeLa cells were transfected with the indicated shRNAs or Bcl2 expressing vector and dead cells were removed by washing 24 hrs later. 36 hrs after the transfection, the cells were treated with nocodazole for another 24 hrs with or without Z-VAD-FMK and then spread and incubated for 12~14 days to allow colony formation. Colonies were stained with crystal violet and counted. The surviving colonies (%) was normalized by setting the percentage of surviving colonies in the control wells to 100. Error bars represent standard deviation. 100 100 100 Surviving Colonies (%) 50 50 50 0 0 0 Nocodazole + Z-VAD-FMK Vehicle Nocodazole Vehicle Nocodazole Vehicle Nocodazole shLuc sh14-3-3h 179 sh14-3-3h 616
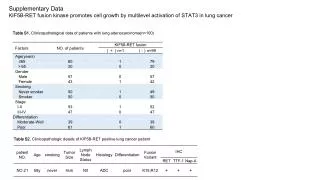
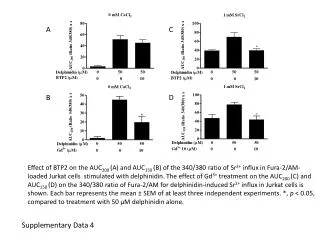
Supplementary Data Figure S4 Nocodazole Cisplatin Rapamycin 100 Relative viability (%) 50 Luc 14-3-3h 179 sh14-3-3h 616 Luc 14-3-3h 179 sh14-3-3h 616 14-3-3h 179 sh14-3-3h 616 Luc shRNA Supplementary data Figure S4. HeLa cells were transfected with the indicated shRNAs, and dead cells were removed by washing 24 hrs later. Thirty-six hrs after the transfection, the cells were treated with nocodazole (660 nM) for another 36 hrs, Cisplatin (24uM) and Rapamycin (20nM) for another 48 hrs. Relative viability was assessed by MTS assay. Data are expressed by the mean of percent cell viability compared to control. Error bars represent standard deviation.