Quantification of Western Blot Data in Figure |
Data normalized with β-tubulin, presented as ratio. Bars show means ± SEM. Statistical significance indicated. |

Quantification of Western Blot Data in Figure |
E N D
Presentation Transcript
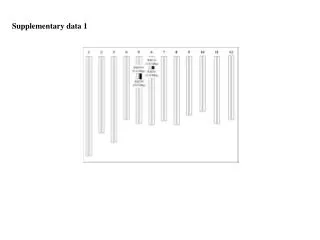
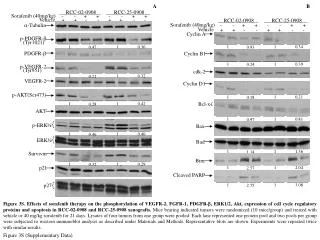
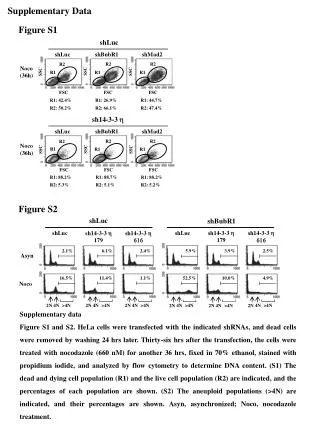
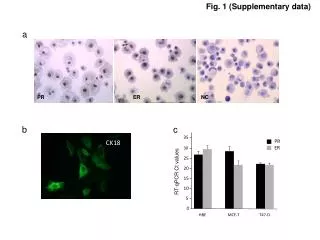
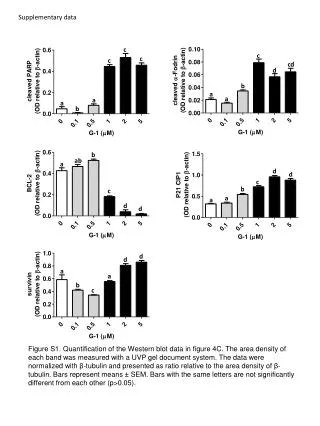
Supplementary data c c c c cd d b a a a a b b ab a d d c b c a a d d d d a a b c Figure S1. Quantification of the Western blot data in figure 4C. The area density of each band was measured with a UVP gel document system. The data were normalized with β-tubulin and presented as ratio relative to the area density of β-tubulin. Bars represent means ± SEM. Bars with the same letters are not significantly different from each other (p>0.05).
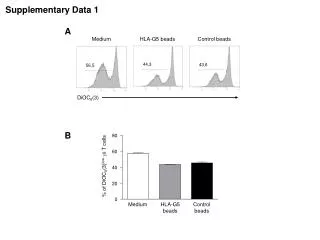
Supplementary data b b c b b a a b a a a a e a a a d c b b c d a a c bc ab ab a a Figure S2. Quantification of the Western blot data in figure 5C. The area density of each band was measured with a UVP gel document system. The data were normalized with β-tubulin and presented as ratio relative to the area density of β-tubulin. Bars represent means ± SEM. Bars with the same letters are not significantly different from each other (p>0.05).
Supplementary data c c cd c d c b b a a a a d d a c b bc c b d d a a a a d d b b c c b c a a Figure S3. Quantification of the Western blot data in figure 6A. The area density of each band was measured with a UVP gel document system. The data were normalized with β-tubulin and presented as ratio relative to the area density of β-tubulin. Bars represent means ± SEM. Bars with the same letters are not significantly different from each other (p>0.05).
Supplementary data d f d e d c c b b a ab a a d d a c b b b b b a a a c b d b c d a a a d d Figure S4. Quantification of the Western blot data in figure 6B. The area density of each band was measured with a UVP gel document system. The data were normalized with β-tubulin and presented as ratio relative to the area density of β-tubulin. Bars represent means ± SEM. Bars with the same letters are not significantly different from each other (p>0.05).