Supplementary Data
Bacillus anthracis CDC 684 wall polysaccharide pyruvylation. Supplementary Data. Bacillus anthracis CDC 684 wall polysaccharide pyruvylation. Supplemental Data Results NMR analysis and identification of the repeated glycosyl units (residues A , B , and C )

Supplementary Data
E N D
Presentation Transcript
Bacillus anthracis CDC 684wall polysaccharide pyruvylation Supplementary Data
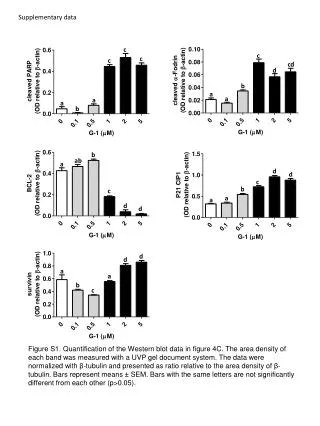
Bacillus anthracis CDC 684wall polysaccharide pyruvylation Supplemental Data Results NMR analysis and identification of the repeated glycosyl units (residues A, B, and C) The downfield anomeric signal at H 5.23 was assigned H1 residue A, subsequently identified as an α-GlcpNAc residue (JC1,H1 174.1 Hz; J1,2 3.3 Hz; H/C reported in Table I). Strong TOCSY (Fig. 4A) and COSY scalar couplings defining H1 through H6, suggested the gluco- configuration, and the chemical shifts obtained from HSQC (Fig. 5A) indicated a nitrogen–bearing carbon at C2 (C 53.47). The carbon shifts, and intraresidue NOEs between H2/H4 and H3/H5 are consistent with a 4C1 glucopyranose ring and identification as α-GlcpNAc. A downfield shift at C6 (C 69.30), relative to unsubstituted residues (Lipkind et al., 1988), indicated this residue was glycosidically substituted at O6. Intraresidue HMBC correlations were also observed for this and all other spin systems, supporting the assignments. In particular, intense HMBC correlations were observed between AH1-AC3 and AH1-AC5, typical of an -pyranose ring form (Supplementary Table; Supplementary Figure S3). Additional low-magnification COSY and NOESY spectra showing the ring proton interactions of these repeating residues (A, B, C) are in Supplementary Figure S2). Residue B, (H1 H 4.89) showed a JC1,H1 of 163.6 Hz, indicative of a -hexopyranose, and unresolved JH1,H2, typical of the manno- configuration. This was confirmed by relatively weak scalar coupling beyond H1/H2. Commencing from H2, scalar coupling was observed in TOCSY analysis from H2 through H6 (Fig. 4A). The coupling pattern, and observed carbon shifts (Table I), together with intraresidue NOEs between H1/H2, and H1/H3/H5 (Fig. 4B), were consistent with a 4C1 chair conformation and a -ManpNAc residue. The downfield H H2, and C C5 are also consistent with the -anomer of a ManpNAc residue (Agrawal, 1992;Lipkind et al., 1988). Residue C, (H1 H 4.53; JC1,H1 162.6 Hz; J1,2 8.2 Hz) was identified as a -GlcpNAc residue based on these coupling constants, strong scalar coupling throughout all positions in the COSY and TOCSY spectra, and strong NOEs between H2/H4 and H1/H3/H5 (Fig. 4B), consistent with a 4C1 pyranose ring. The carbon shifts were assigned from the combined TOCSY, HSQC, and NOE data and confirmed by intraresidue HMBC correlations (Supplementary Table; Supplementary Figure S3). Positions 3 and 4 initially presented some uncertainty in carbon assignment (having similar H), but this was clarified by HMBC connectivities between H6a ( 3.88) and C5 ( 75.64) and between H6a and a deshielded carbon assigned as C4 (C 80.06) (Supplementary Figure S6) indicating C4, not C3, as likely site of glycosidic substitution. This was confirmed by interresidue NOEs and HMBC correlations described below. For all three HexNAc residues (A, B, C) N-acetylation was indicated by HMBC connectivities between H2 and the acetyl group carbonyl carbon (Supplementary Figure S6), and between the carbonyl carbon and methyl group protons, and by NOEs between the acetate methyl protons and their respective H2 and H1 ring protons. These results indicate that the three HexNAc residues occur in identical ratio and configuration to the three HexNAc components comprising the repeating backbone of the normal SCWPs from pathogenic B. anthracis and B. cereus (Choudhury et al., 2006;Forsberg et al., 2011). The identities and ratios of the three HexNAc components were also confirmed by GC-MS analyses of the TMS-methyl glycosides (not shown). Glycosyl sequence of repeating residues A, B, and C as determined from interresidue HMBC and NOE analyses Residue A, the repeating α-GlcNAc residue, displayed a strong NOE from H1 ( 5.23) to H4 ( 3.66) of residue B, suggesting linkage to that position. The GlcNAc(14)ManNAc(1 linkage was subsequently proven by two interglycosidic HMBC correlations, between AH1-BC4 (H/C 5.23-74.67), and between BH4-AC1 (H/C 3.66-99.49), Supplementary Figure S3. Residue B, the repeating -ManNAc residue, showed an intense NOE from H1 ( 4.89) to H4 ( 3.71) of residue C. The ManNAc(14)GlcNAc(1 sequence was confirmed by an HMBC correlation between BH1-CC4 (H/C 4.89-80.06), and by a second
Bacillus anthracis CDC 684wall polysaccharide pyruvylation Supplemental Data Results (continued) HMBC connection between CH4-BC1 (H/C 3.72-100.45). Residue C, the repeating -GlcNAc residue, displayed a strong inter-residue NOE between H1 ( 4.53) and two protons at 4.10 and 3.83, the H6 protons of residue A. The sequence, GlcNAc(16)GlcNAc(1was subsequently proven by HMBC connectivities between CH1-AC6 ( 4.53-69.30), and between AH6a-CC1 ( 4.10-102.70) and AH6b-CC1 ( 3.83-102.70). These results indicated a repeating trisaccharide sequence of 4)--D-ManpNAc-(14)--D-GlcpNAc-(16)--D-GlcpNAc-(1, identical in all respects to the glycosyl backbones shared by all B. anthracis strains (Choudhury et al., 2006) and pathogenic B. cereus strains (Forsberg et al., 2011) examined. References Agrawal, P. K. 1992. NMR spectroscopy in the structural elucidation of oligosaccharides and glycosides. Phytochemistry 31:3307-3330. Choudhury, B., C. Leoff, E. Saile, P. Wilkins, C. P. Quinn, E. L. Kannenberg, and R. W. Carlson. 2006a. The structure of the major cell wall polysaccharide of Bacillus anthracis is species-specific. J.Biol.Chem. 281:27932-27941. Forsberg, L. S., B. Choudhury, C. Leoff, C. K. Marston, A. R. Hoffmaster, E. Saile, C. P. Quinn, E. L. Kannenberg, and R. W. Carlson. 2011a. Secondary cell wall polysaccharides from Bacillus cereus strains G9241, 03BB87, and 03BB102 causing fatal pneumonia share similar glycosyl structures with the polysaccharides from Bacillus anthracis. Glycobiology 21:934-948. Lipkind, G. M., A. S. Shashkov, Y. A. Knirel, E. V. Vinogradov, and N. K. Kochetkov. 1988a. A computer-assisted structural analysis of regular polysaccharides on the basis of 13C-n.m.r. data. Carbohydr.Res. 175:59-75.
CH3-C=O (NAc) Bacillus anthracis CDC 684wall polysaccharide pyruvylation
Bacillus anthracis CDC 684wall polysaccharide pyruvylation Supplementary Table HMBC correlations (continued)
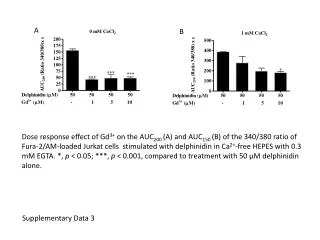
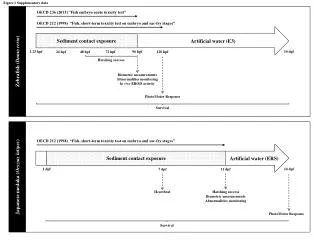
Bc14579 dextran standard 35 - 40,000 Da Bacillus anthracis CDC 684wall polysaccharide pyruvylation Vo Vi 1 2 3 A Ba CDC 684 B Detector response Ba Sterne 34F2 C 0.0 10.0 20.0 30.0 40.0 50.0 min. Elution time Supplementary Fig. S1
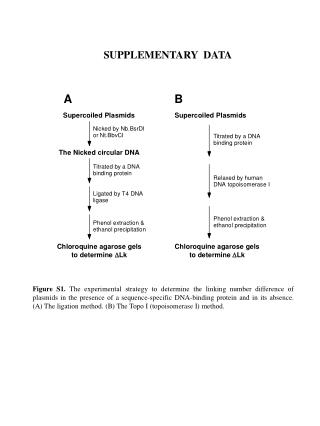
Bacillus anthracis CDC 684wall polysaccharide pyruvylation refractive index (RI) response (mV) Absorbance 215 nm Absorbance 280 nm standard dextran 35-40 kDa detected by RI Supplementary Fig. S1 Purification and molecular size estimation of the SCWP isolated from Bacillusanthracis CDC 684 and related Bacillus strains. SCWPs were released from cell walls by treatment with hydrofluoric acid, dialyzed, then chromatographed on a Superose-12 FPLC size exclusion column, in comparison to standard 16 linked dextrans. A, B. anthracis CDC 684. B, B. anthracis Sterne 34F2. C, type strain B. cereus ATCC14579. The B. anthracis CDC 684 SCWP yielded a peak with Kav of 0.323, corresponding to an apparent mass of approximately 22,000 Da. In comparison, the mobilities of SCWPs isolated from normal (pathogenic) strains of B. anthracis (Sterne, Pasteur, Ames) indicated masses of around 10,000 Da (Kav 0.433). The non-pathogenic B. cereus type strain ATCC14579 SCWP elutes slightly after the 25 kDa dextran, (Kav 0.337; calc. mass 20,020 Da). The pathogenic B. cereus G9241 SCWP elutes at 12,000 Da (Kav 0.411) (see Forsberg et al., 2011). The Bacillus SCWP preparations contain variable amounts of a high molecular weight glucan which elutes at the void volume (Vo). Column total inclusion volume, (Vi). The elution positions of the 25 kDa and 11 kDa dextrans are indicated (1= 35-45 kDa; 2 = 25 kDa; 3 = 11 kDa). Attempts to obtain molecular ions for the purified, polymeric SCWPs using MALDI-TOF mass spectrometry have so far proven unsuccessful; these polymeric SCWPs fail to desorb using several common matrices. Our previous reports have published MALDI-TOF spectra of lower degree of polymerization (lower DP) oligosaccharides, derived from these SCWP (see Forsberg et al., 2011). Such lower DP oligomers desorb well, although the response appears to fall off rapidly above a DP of about 12-15 HexNAc residues, similar to the situation we observe with chitin oligomers.
Bacillus anthracis CDC 684wall polysaccharide pyruvylation A B A B C Supplementary Fig. S2 Partial 1H-1H COSY spectrum (A), and 1H-1H NOESY spectrum (B) displayed at normal magnification allowing visualization of the scalar connectivities arising primarily from the repeating unit residues, A, B, and C.
Bacillus anthracis CDC 684wall polysaccharide pyruvylation BH1-BC2 CH3-CC2 AH3-AC2 BH4-BC6 CH1-AC6 AH1-AC3 BH2-C=O (NAc) AH4-AC6 AH1-AC5 AH4-AC3 AH4-AC5 BH2-BC3 AH1-BC4 b BH2-BC4 a CH3-CC4 BH1-CC4 CH4-BC1 BH4-AC1 c BH4-A′C1 residual 1-bond coupling BH2-BC1 CH2-CC1 AH6a,b-CC1 Supplementary Fig. S3 Partial 1H-13C HMBC spectrum of the B. anthracis CDC 684 SCWP. This low intensity spectrum primarily shows strong connectivities arising from the repeated units (residues A,B,C). Regions enclosed by boxes (a, b, and c) are shown at high intensity in Supplemental Data Figures S6 and S10, allowing visualization of the non-repeated structural features on the SCWP. All connectivities are of the sequence: "proton-carbon", for example: AH1-BC4 represents a three-bond inter-residue correlation between the anomeric proton of residue A and C4 of residue B. Signals correlating to carbonyl carbons are folded back into the spectrum (see Table I for C). Labels in red text designate inter-residue connectivities.
Bacillus anthracis CDC 684wall polysaccharide pyruvylation A D B E C F Supplementary Fig. S4 Comparison of 600-MHz proton NMR spectra for the SCWPs from B. anthracis CDC 684, pathogenic B. anthracis, and related B. cereus strains. A, B. anthracis CDC 684; B, B. anthracis Sterne 7702; C, B. anthracis Sterne 34F2; D, B. cereus G9241; E, B. cereus ATCC10987; and F, B. cereus ATCC14579. The pyruvate methyl proton signal (1.54 -1.46) is marked by an arrow.
Bacillus anthracis CDC 684wall polysaccharide pyruvylation B′2/5 B′1/5 B′1/C′4 B′1/2 B1/2 B′ B B B′ B′′ B′′ + C B′1/2 B′′1/2 C′ B′2 B′ Bacillus anthracis CDC 684wall polysaccharide pyruvylation NOESY TOCSY B′′1/5 C′1/5 B′2/4 B′′1/C4 C1/3 C1/4 C′1/6 C1/2 C1/6 C′1/2 C′1/4 B′2/3 B′′1/3 B′1/3 B′1/3 B′2/6 B′′1/2 Supplementary Fig. S5 Partial 1H-1H TOCSY and 1H-1H NOESY spectra of the B. anthracis CDC 684 SCWP showing features of the C′, B′, and B′′ residues. Left panel, NOESY; right panel, TOCSY. The spectra, displayed at high magnification, allow visualization of the weak signals arising from the substoichiometric residues which are located at the non-reducing terminus of the SCWP. At this magnification, connectivities arising from the repeating residue B are not well resolved. Inter-residue NOEs between residue B′ and C′, and between residue B′′ and C are labeled in red text.
CH6-CC4 CH6-CC5 Bacillus anthracis CDC 684wall polysaccharide pyruvylation a AH2-C=O (NAc) CH2-C=O (NAc) CH4-CC3 AH3-AC4 CH2-CC3 AH2-AC3 AH6-AC4 BH4-BC3 AH6-AC5 BH6-BC4 BH5-BC4 BH3-BC4 BH6-BC5 BH4-BC5 CH3-CC4 B′H2-C=O (NAc) BH2-C=O (NAc) b CH1-AC6 BH2-BC3 C′H1-A′C6 BH2-BC4 C′H1-AC6 Supplementary Fig. S6 1H-13C partial HMBC spectra of B. anthracis CDC 684 SCWP. Shown are high intensity expanded regions a and b from Supplementary Figure S3, to allow display of weaker connectivities. Signals correlating to carbonyl carbons are folded back into the spectrum (see Table I for C) allowing greater resolution in F1 dimension.
Bacillus anthracis CDC 684wall polysaccharide pyruvylation C2 C′2 (C′2 +A2) B′′1,2 B′′2,3 D1 C′1 C′1,2 B′1 B′1,2 B1 B1,2 B′′1 B′′1,2 C′2 C′3,2 C′3,4 C′3 C′4 C′3 C′4 D D A1 B1 C1 100.0 C′1 B′′1 B′1 A′1 105.0 Supplementary Fig. S7
Bacillus anthracis CDC 684wall polysaccharide pyruvylation Supplementary Fig. S7 Partial 1H-1H COSY and 1H-13C HSQC spectra of the B. anthracis CDC 684 SCWP defining features of the C′, B′, and B′′ spin systems. Top and bottom panels, HSQC; middle panel, COSY. The spectra, displayed at high magnification, allow visualization of the weak signals arising from the substoichiometric residues which are located at the non-reducing terminus of the SCWP. Signals arising from the reducing end (residue D) are also labeled. Several weak signals ( 4.75 and 4.47) arise from contaminants. The region enclosed by box is expanded in SupplementalFig. S8.
Bacillus anthracis CDC 684wall polysaccharide pyruvylation B5/6a B5/6b B5/4 0 C′5/4 5 0 C′5/6a C′5/6b 5 0 C′3/4 C′3/2 5 0 D 1/2 (-reducing end) 5 Supplementary Fig. S8 Selected 1H-1H COSY spectral regions of the B. anthracis CDC 684 SCWP defining features of the C′ spin system. At high magnification, intense signals arising from the repeated residues (e.g., residue B) are unresolved. C′3/4 = H5.08/3.92; C′3/2 = H5.08/3.88.
C C′3 C′ Bacillus anthracis CDC 684wall polysaccharide pyruvylation B B2 A C B′ D C′ C′3 B′′ D Supplementary Fig. S9 Partial 1H-1H TOCSY and 1H-1H NOESY spectra of the B. anthracis CDC 684 SCWP further defining features of the C′ residue. Top panel,1H spectrum indicating anomeric signals arising from “prime” residues; middle panel, TOCSY; bottom panel, NOESY. The spectra at high magnification, allow visualization of the weak signals arising from residue C′, the 3-O-acetylated -GlcNAc residue located penultimate to the non-reducing end pyruvylated--ManNAc (residue B′). Regions outlined by boxes are expanded in Supplementary Fig. S5. 1,5 3,5 3,6 1,6 1,2 3,2 1,4 3,4 3,1 C'3/5 C′1/5 C1/A6 C′1/A′6 C1/A6 C′1/A′6 C'3/1
Bacillus anthracis CDC 684wall polysaccharide pyruvylation e B′ C′ A′ C′H4-C′C3 B a a B′′H1-B′′C2 B′H1-B′C2 repeating residues C ′H3-C ′C2 BH3-BC2 f C ′H1-AC6 C ′H3-OAc (C=O) C ′H1-A′C6 d A′H2-A′C1 CH1-AC6 CH1-A′C6 C′H4-B′C1 B′H1-C ′C4 C ′H3-C′C4 AH6a-CC1 AH6b-CC1 b c e C′3 BH4-AC1 D1 C ′H4-B′C1 d A1 B1 A′1 residual 1-bond coupling C1 BH4-A′C1 B′′1 B′1 C′1 Supplementary Fig. S10 Expanded NMR spectra of B. anthracis CDC 684 SCWP. Selected regions of 1H-13C HMBC (panels a, c, d, e) and 1H-13C HSQC (panel b) displaying interglycosidic connectivities between residues B′, C′ and A′ and linkage from residue A′ to the repeating residue B(BH4-A′C1). The spectra are shown at high intensity to allow visualization of these weak connectivities. Regions inside boxes (d and e) are expanded. Box f is expanded in Supplementary Fig. S11.
Bacillus anthracis CDC 684wall polysaccharide pyruvylation B′ C′ A′ B repeating residues AH1-AC2 B′′H1-B′′C2 BH1-BC2 B′H1-B′C2 C ′H3-C ′C2 C ′H1-A′C6 C ′H1-AC6 C ′H3-OAc (C=O) AH1-AC3 DH1-DC3 AH1-AC5 BH1-BC5 AH1-BC4 B ′H1-C ′C4 C ′H3-C ′C4 B′′H1-CC4 BH1-CC4 Supplementary Fig. S11 Partial 1H-13C HMBC spectrum of B. anthracis CDC 684 SCWP showing expanded region from the previous Fig. S10, providing detailed view of several inter-glycosidic connectivities involving the non repeating residues B′, C′ and A′. Signals correlating to carbonyl carbon are folded back into the spectrum (see Table I for C).
Bacillus anthracis CDC 684wall polysaccharide pyruvylation H2 2.74/54.75 2.80/54.75 H2 3.39/69.34 H4 H4 3.37/69.34 H3 3.51/73.65 3.56/73.65 H3 3.79/72.6 H5 H5 3.78/72.6 H1 5.234/100.35 5.272/99.96 H1 3.00 2. 3.00 2 ppm (t2) ppm (t2) Supplementary Fig. S12 Partial TOCSY spectra of B. anthracis CDC 684 SCWP showing some of the scalar couplings defining substoichiometric residue A′,including the migration of the H shifts due to sample manipulation to new NMR tube and during storage, indicative of ionic strength and pH influence of charge state at H2 of this free 2-amino sugar (-GlcNH2). Over time, the magnitude of H shift is greatest at positions H1 thru H4; the H6 H remained relatively unchanged (4.10 and 3.83 ppm).
Bacillus anthracis CDC 684wall polysaccharide pyruvylation C A ManNAcH2/C2 B'H6 D B ManNAcH2-C1 GlcNAcH4-GalC1 (S)-PyrC2-B′H6 Supplementary Fig. S13 Partial 600-MHz NMR spectra indicating the linkage of pyruvate to the terminal ManNAc residue in pathogenic B. anthracis Sterne strain 7702 SCWP. A, 1H-13C HSQC; B,1H-13C HMBC; CandD, HMBC spectra of the pyruvate spin system. Spectra in A and B show signals analogous to (virtually superimposable with) signals originating from residue B′, the pyruvylated -ManNAc residue in Ba684 SCWP. Spectra are shown at high intensity to allow visualization of this structural modification, which occurs at only one location in the SCWP, at the nonreducing end -ManNAc.